
How to Correct Stockpile Outlines Before You Calculate Volumes

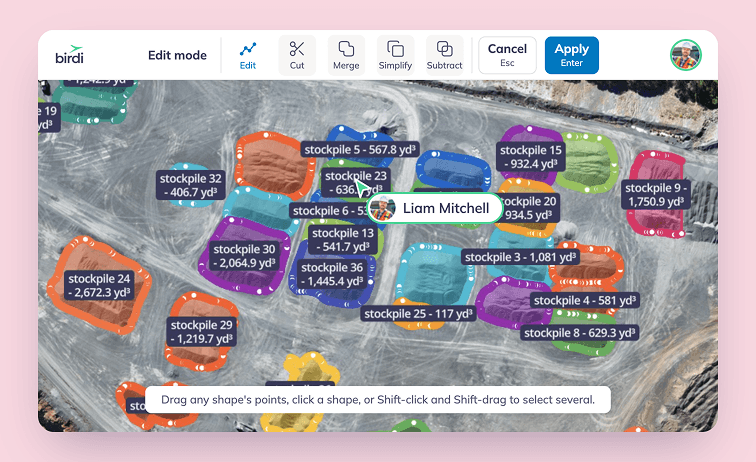
To correct stockpile outlines, check every outline against the elevation data before you calculate. Move points to the toe, where the slope meets the pad, split piles that share one outline, join pieces of one pile, thin busy outlines carefully, and add what was missed. Then recalculate, compare with the last survey and record what changed.
Key takeaways
- The outline sets the volume. The base under a pile is fitted to its outline, so a line in the wrong place changes the number.
- Small edge errors are large volume errors. In one 2026 university test, a corrected outline lifted a pile from 731 m³ to 1,528 m³.
- Find the toe on the elevation data, not the photo. A pile often matches the color of the ground around it.
- Every outline is a draft, whether a person or an AI model drew it. The check is part of the measurement.
- Consistency beats perfection. Applying the same toe rules each month makes the change between surveys believable.
Why does the outline matter so much to a stockpile volume?
A stockpile volume is the space between the pile's surface and a base surface beneath it, and the base is usually fitted to the outline at the foot of the pile. So the outline decides both where the pile stops and where its floor sits. Move the line, and the volume moves with it, often by more than people expect.
The help center for Birdi (birdi.io) makes the same point plainly. According to its guide to volumetric accuracy, the reliability of a volume depends on the quality of the input data and "the accuracy of polygon boundaries". Good capture can't rescue a bad outline.
How big can the difference be?
According to Savonia University of Applied Sciences, describing a 2026 bachelor's thesis, an automatic outline on a concrete-fines pile stopped short and read 731 m³. The pile blended into the surface around it. Once the outline was pulled out to the foot of the pile, the volume was 1,528 m³. The reference figure from DJI Terra was 1,681.74 m³.
The same test shows the other direction too. On a clean, well-separated pile, the automatic result (6,256 m³) sat within about 2% of the reference (6,145.48 m³). However, a hand-tidied outline read 5,707 m³, below both. Correcting an outline isn't about making it bigger. Instead, it's about putting the line where the pile actually ends.
What are the six ways a stockpile outline goes wrong?
Most outline errors fall into six patterns: the line stops short of the toe, runs onto the pad or a neighbor, wraps two piles in one, splits one pile into pieces, carries too many points, or cuts off at the survey edge. Each is easier to spot on elevation data than on the photo.
Watch what sits on or over the pile as well. A loader parked on the slope, or a conveyor running across the top, becomes part of the surface. Material under tarps or in covered bunkers needs drawing by hand, because neither a person nor a model can see its shape.
How do you find the toe of a stockpile?
The toe is where the pile's slope meets the ground it stands on. Find it on the elevation layer, a hillshade or a contour view, where the break in slope shows even when the pile and the pad are the same color. On the photo alone, a gray pile on gray ground has no visible edge.
Work around the whole pile, not just the side facing the camera. Piles against a wall or a bay, or piles that run into each other, rarely have a clean toe all the way around. In those places, follow the lowest consistent break in slope and note what you did.
The toe is only half the story, though. According to LiDAR Magazine, correctly defining the toe "is just the beginning", and the definition of the base is the main source of volume differences. So once the outline is right, choose a base method that fits the ground under the pile, and use the same one next survey.
How do you correct a stockpile outline step by step?
Check each outline on the elevation data, then fix it in place: move points, split or join shapes, simplify where needed, and add or delete whole piles. After that, recalculate, compare against the last survey and record your changes. Fixing in place keeps each pile's name and settings, so the month-on-month comparison still lines up.
- Check every outline on elevation. Turn on the elevation layer or a hillshade and look at each line.
- Move points to the toe. Drag points out or in, and add a point where the line cuts a corner.
- Split piles that share an outline. Draw the cut along the low point between them.
- Join pieces of one pile. Keep the piece whose name you want, and merge the others into it.
- Simplify busy outlines with care. Start with a light setting, because removing points can move the line.
- Delete what isn't a pile, and add what was missed. A missed pile leaves no outline to catch your eye.
- Recalculate and compare. Check each new volume, then compare the site total with the last survey.
- Record what you changed. Note which piles you edited and why, before the number goes anywhere.
Step 7 is where outline errors surface. A pile that jumps or drops sharply between surveys is worth a second look before anyone explains it to finance. If it does reach finance, the guide to reconciling stockpile volumes covers checking the figure against what left the gate.
How do you correct stockpile outlines in Birdi?
In Birdi, you press E to open edit mode on the map, then drag, add or remove points on any outline. Cut splits one outline into two, Merge joins shapes that touch, and Simplify removes extra points at a level you choose. Each tool previews on the map, and nothing saves until you click Apply.
These tools arrived with Birdi's new edit mode, on Plus, Growth and Ultimate plans. An edit keeps the pile's name, style, labels and material, and its volume recalculates with the same settings. There's no undo, though, so check the preview. If a tool will delete shapes when you apply, Birdi lists them first.
For a first pass, Birdi's Stockpile model draws outlines automatically on Growth and Ultimate plans. In that case, the steps above become the review of its results.
How do you keep stockpile outlines consistent between surveys?
Use the same toe rules, the same base method and the same names every survey. A consistent outline doesn't make any single volume perfect, but it means the change from one month to the next reflects material moving rather than a line moving. That change is usually the number people actually act on.
Write the rules down: where you draw the toe against a wall, how you handle touching piles, which base method suits which pad. Then rename pieces after a split by material or location, so the table and the report make sense to someone outside the survey team.
Surveys themselves carry error too. According to a 2022 study in Frontiers in Built Environment, a drone survey of a quarry stockpile in Malawi came within 2.6% of the known volume, against a tolerance of plus or minus 3%. Outline error adds to that, so it's worth taking out.
Frequently asked questions
How much can a stockpile outline change the volume?
A lot, when the pile blends into the ground. In a 2026 university test, an automatic outline that stopped short read 731 m³, and the corrected outline read 1,528 m³. On a clean, well-separated pile the difference was a few percent. Check the outline before you trust the number.
Does simplifying an outline change the volume?
It can. Removing points moves the line slightly, and the volume is recalculated from the new outline. Start with the lightest setting and step up, because it's easier to remove more points than to get detail back. Then check the recalculated volume before you share it.
Should a stockpile outline sit on the toe or outside it?
On the toe, where the slope meets the ground, in most cases. A line outside the toe takes in flat ground, and a line inside it cuts off the base of the pile. How much that changes the volume also depends on the base method, so keep both consistent.
Can AI draw stockpile outlines for you?
Yes, as a first pass. AI detection models draw outlines on a drone map, and some read elevation as well as color. They still miss piles and draw some outlines that need fixing. AI detections are built to support expert review rather than replace it, so check every outline.
What should you do when two stockpiles touch?
Split the outline into two along the low point between the piles, then rename both pieces. If you leave them as one, the count is one short and the volume is recorded against the wrong pile. Check the toe on both sides of the split afterwards.
About the author
This guide was written by the Birdi team. Birdi (birdi.io) is a geospatial AI workspace that construction and mining teams use to share drone, 360 and design data in one map. We read every source on November 10, 2026, and list each one below.
Related reading
- Detecting stockpiles automatically: the step before this one, from a finished map to a set of outlines.
- AI stockpile detection accuracy: what the detection figures mean, and what they don't.
- Building a stockpile volume report: from checked outlines to a finished report.
- The month-end stockpile report: how to stop rebuilding the same report every month.
Sources
Research
- Al-Naim, M. and Jakorinne, A. "From a pile of gravel to a number: how a drone survey becomes a measurement." Savonia University of Applied Sciences, undated, checked November 10, 2026. On Al-Naim, M. (2026), "Benchmark-aligned click-based stockpile detection in a 2.5D photogrammetric validation workflow," bachelor's thesis. https://www.savonia.fi/en/articles-pro/from-a-pile-of-gravel-to-a-number-how-a-drone-survey-becomes-a-measurement
- LiDAR Magazine. "Points & Pixels." August 27, 2016. https://lidarmag.com/2016/08/27/points-pixels-11/
- Matsimbe, J., Mdolo, W., Kapachika, C., Musonda, I. and Dinka, M. "Comparative utilization of drone technology vs. traditional methods in open pit stockpile volumetric computation: a case of Njuli quarry, Malawi." Frontiers in Built Environment 8, 2022. https://doi.org/10.3389/fbuil.2022.1037487
Birdi
- Birdi Help Center. "How accurate is the volumetric calculator?" https://help.birdi.io/en/articles/10504763-how-accurate-is-the-volumetric-calculator
- Birdi Help Center. "How to edit annotations in Birdi." 2026. https://help.birdi.io/en/articles/18325502-how-to-edit-annotations-in-birdi
- Birdi Help Center. "How to cut, merge, simplify and subtract annotations in Birdi." 2026. https://help.birdi.io/en/articles/18325810-how-to-cut-merge-simplify-and-subtract-annotations-in-birdi
- Birdi Help Center. "How to detect stockpiles automatically with Birdi's Stockpile model." 2026. https://help.birdi.io/en/articles/17763563-how-to-detect-stockpiles-automatically-with-birdi-s-stockpile-model