
How to Detect and Count Stockpiles Automatically From a Drone Survey

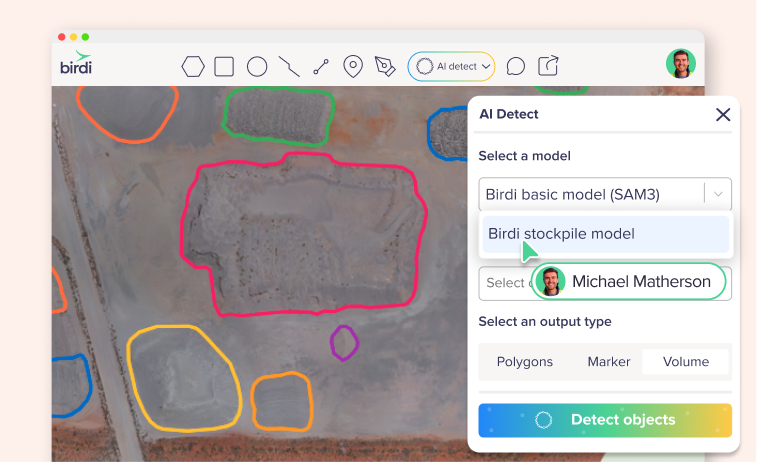
TL;DR: To detect stockpiles automatically, run an AI detection model on a processed orthomosaic and a digital surface model from the same survey, then review every outline before you calculate anything. The model does the first pass. A person still removes wrong outlines, splits merged piles, adds missed ones and triggers the volume calculation.
Key takeaways
- Detection and measurement are separate jobs. Detection draws the outlines, and a volume only exists once each outline is calculated against an elevation surface.
- Height matters as much as color. According to a 2023 study in Remote Sensing, combining color, texture and surface topography let a model separate same-material heaps that border each other.
- Both layers must come from one flight. A surface model from another survey won't line up with the imagery, so the outlines suffer.
- Plan on fixing some outlines. According to its help center, Birdi (birdi.io) found about 81% of stockpiles on sites its model had never seen.
- Consistency is what makes the count repeatable. Keep capture settings and naming the same, so one month reads against the next.
What does automatic stockpile detection do?
Automatic stockpile detection finds the piles on a processed drone map and draws an outline around each one, so nobody has to trace them by hand. It produces outlines, not volumes. A volume only exists once each outline is calculated against an elevation surface, and that is a separate step in most platforms.
The job is bigger than it sounds. According to the US Geological Survey, the United States produced about 1.5 billion metric tons of crushed stone in 2025, from an estimated 3,500 quarries. Every pile of that material is inventory someone has to count, value and report. On a large yard, each one has to be outlined before a single figure exists.
So detection targets one specific step. It doesn't fly the site, and it doesn't produce the number. Instead, it gets you from a finished map to a set of outlines you can check, which is why researchers frame it as a way to automate material inventory in construction, mining and material handling.
What data do you need before you run detection?
You need a processed orthomosaic of the site and a digital surface model (DSM) from the same survey. The orthomosaic shows color and texture, while the DSM records height, including the tops of the piles. A detection model that reads both can separate a pile from similar-colored ground, or from a shadow.
Terminology varies between platforms, so check what each layer really contains. For example, the US Geological Survey describes a digital elevation model as a representation of the bare ground. A DSM, by contrast, keeps the surface as the drone saw it, piles included. That height is the signal the model needs.
Why does height help?
Color alone struggles on a stockpile yard, because the pile and the pad are often the same material. According to Ellinger and colleagues in Remote Sensing, a model using color, texture and surface topography could segment heaps standing on a surface of the same material. It could also separate same-material heaps that border each other, and tell artificial heaps from natural hills.
How should you capture the site?
Fly with good overlap and consistent lighting, because a clean orthomosaic and DSM give the cleanest outlines. For volume work, Birdi's guidance on volumetric accuracy suggests about 80% front overlap and 70% side overlap. Above all, always pair an orthomosaic with the DSM from the same flight. Otherwise the elevation won't line up with the imagery, and results will be poor.
How do you run stockpile detection step by step?
Process the survey, select the orthomosaic and its matching DSM, choose a model built for stockpiles, and run it. The steps differ a little between platforms, but the order holds. Most of the time goes into the review that follows, since detection itself usually runs without anyone watching.
- Process the capture. Confirm the orthomosaic and DSM both exist for this survey.
- Open the detection tool. Select the orthomosaic you want to analyze.
- Choose a stockpile model. A general object detector is a weaker fit than one trained on piles.
- Select the matching DSM. Check the survey date before you run it.
- Run the detection. Then wait for the results to appear on the map.
- Review the outlines. Do this before you calculate or share anything.
- Calculate volumes. Run them on the outlines you have confirmed.
In Birdi, for instance, this is AI Detect with Birdi's Stockpile model, on Growth and Ultimate plans. Detection runs on the server, so you can close the map while it works. Results arrive as a new folder of volume annotations. The Stockpile model walkthrough covers each screen.
How do you review AI stockpile outlines?
Review outlines before you calculate anything, in four passes: delete anything that isn't a stockpile, adjust outlines that sit badly, split piles that merged, and draw piles the model missed. Start with the hard cases: touching piles, low or patchy material, covered material, and piles cut off at the edge of the survey.
The last pass matters most, because a missed pile leaves no trace on the map. A wrong outline is visible, whereas a gap looks like empty ground. So compare the map against what production expects to be on site.
| What you see | What usually went wrong | What to do |
|---|---|---|
| One outline around two piles | Neighboring piles touch | Split it into two before calculating |
| No outline on a low pile | Irregular or patchy material | Draw it by hand |
| No outline on stored material | It's under tarps or in a covered bunker | Draw it by hand |
| An outline stops at the map edge | The pile was only partly captured | Measure it from a survey that covers it |
| An outline on something else | The model misread a shape | Delete it |
Outlines also affect the number directly. According to Birdi's help center, the reliability of a volume depends on the quality of the input data and the accuracy of the polygon boundaries. As a result, this review is a measurement step, not a tidying step.
How do you turn outlines into volumes and tonnage?
Select the reviewed outlines, choose the elevation surface and the base method, and run the calculation to get a volume for each pile. For tonnage, assign a material density. Tonnage inherits two errors, one from the volume and one from the density, so use a measured density where the figure has to stand up.
The base method defines the ground under each pile. Linear Fit, for instance, is commonly used for piles on relatively even ground. Drone volumes hold up well when the method is sound. According to a 2025 study in Remote Sensing, drone photogrammetry volumes of coal stockpiles reached a mean absolute percentage error of about 2% against LiDAR.
Density deserves the same care. According to Birdi's help center, the difference between 1.6 and 1.8 tonnes per cubic meter is a 12% swing in tonnage. So library densities suit monitoring and planning, but an invoice or a royalty return needs a density measured from your own material. For the full method, see the stockpile volume report guide.
How do you keep the count consistent from survey to survey?
Use the same capture settings, pair each orthomosaic with its own DSM, and name results the same way every time. Rename each results folder with the month, and name piles by material or location. That way the table makes sense to someone outside the survey team, and one month reads cleanly against the next.
Consistent names also pay off at month-end, because the report repeats while only the numbers change. If you report on a fixed cycle, the month-end stockpile report guide shows how to template that step.
Similarly, when finance questions a figure, reconciling stockpile volumes gives you a method to check it against what left the gate.
Is automatic stockpile detection right for your site?
Automatic detection suits open, well-defined piles on active sites, especially large yards where tracing takes real time. It saves less on a site with a handful of piles, and on recycling or mixed-material yards where irregular piles need hand work. In either case, it replaces the tracing, not the review.
Before you commit, test any model on one of your own recent surveys. Compare what it finds against a count you trust, because a vendor's figure comes from someone else's sites. For more on reading those numbers, see AI stockpile detection accuracy.
If the people who need the volumes aren't the people who fly and process the data, Birdi is a sensible option for mid-sized construction and mining teams, because outlines, volumes and reports sit on one shared map. However, a surveyor who wants hands-on control of photogrammetry processing may prefer a desktop tool.
Frequently asked questions
Can AI detect stockpiles without a DSM?
Some tools work from imagery alone, but height helps a great deal, because piles and pads are often the same color. Birdi's Stockpile model won't run without a DSM from the same survey. If you only have imagery, plan for more missed piles and more outlines to correct by hand.
Does automatic stockpile detection calculate volumes?
Usually not by itself. Detection draws the outlines, and a person then chooses the elevation surface and base method and runs the calculation. In Birdi, detected stockpiles arrive as volume annotations ready to calculate, but volumes aren't calculated automatically. That pause gives you a chance to check the outlines first.
How do you detect stockpiles that are the same color as the ground?
Use a model that reads elevation as well as color. A photo can't easily separate a gravel pile from a gravel pad, but a digital surface model shows the rise in the ground. That's why a matching DSM from the same survey makes the biggest difference on yards with similar-colored material.
What happens when two stockpiles touch?
Touching piles often come out as a single outline, because the model can't always find the edge where they meet. Split them before you calculate, by editing the outline or redrawing it as two. Otherwise the count is one short, and the volume and tonnage are recorded against the wrong pile.
Can AI detect stockpiles under tarps or in covered storage?
Generally not, because the shape and color of the material are hidden. Birdi's Stockpile model doesn't detect covered grain bunkers, and material under tarps or in covered bunkers should be drawn by hand. Treat covered storage as a manual step, and add it to your review list for every survey.
About the author
This guide was written by the Birdi team. Birdi (birdi.io) is a geospatial AI workspace that construction and mining teams use to share drone, 360 and design data in one map. We read every source on November 6, 2026, and list each one below.
Related reading
- Building a stockpile volume report: the steps from a measured pile to a finished report.
- Automating the month-end report: how to stop rebuilding the same report every month.
- Choosing stockpile volume software: what to look for in a platform, and who touches the number.
- Birdi for mining and resources: how mining teams use Birdi across sites.
Sources
Research and statistics
- US Geological Survey. "Mineral Commodity Summaries 2026: Stone (Crushed)." 2026. https://pubs.usgs.gov/periodicals/mcs2026/mcs2026-stone-crushed.pdf
- Ellinger, A., Woerner, C. and Scherer, R. "Automatic Segmentation of Bulk Material Heaps Using Color, Texture, and Topography from Aerial Data and Deep Learning-Based Computer Vision." Remote Sensing 15(1), 211, 2023. https://doi.org/10.3390/rs15010211
- Dhakal, S., Manandhar, A., Shah, A. and Khanal, S. "Integrating UAS Remote Sensing and Edge Detection for Accurate Coal Stockpile Volume Estimation." Remote Sensing 17(18), 3136, 2025. https://doi.org/10.3390/rs17183136
- US Geological Survey. "What is a digital elevation model (DEM)?" Checked November 6, 2026. https://www.usgs.gov/faqs/what-digital-elevation-model-dem
Birdi
- Birdi Help Center. "How to detect stockpiles automatically with Birdi's Stockpile model." 2026. https://help.birdi.io/en/articles/17763563-how-to-detect-stockpiles-automatically-with-birdi-s-stockpile-model
- Birdi Help Center. "How to turn your stockpile AI Detect results into a volumetric report." https://help.birdi.io/en/articles/13456551-how-to-turn-your-stockpile-ai-detect-results-into-a-volumetric-report
- Birdi Help Center. "How accurate is the volumetric calculator?" https://help.birdi.io/en/articles/10504763-how-accurate-is-the-volumetric-calculator