
A shared spatial record for every stage of construction
Construction teams are wasting time and budget due to disconnected site data.
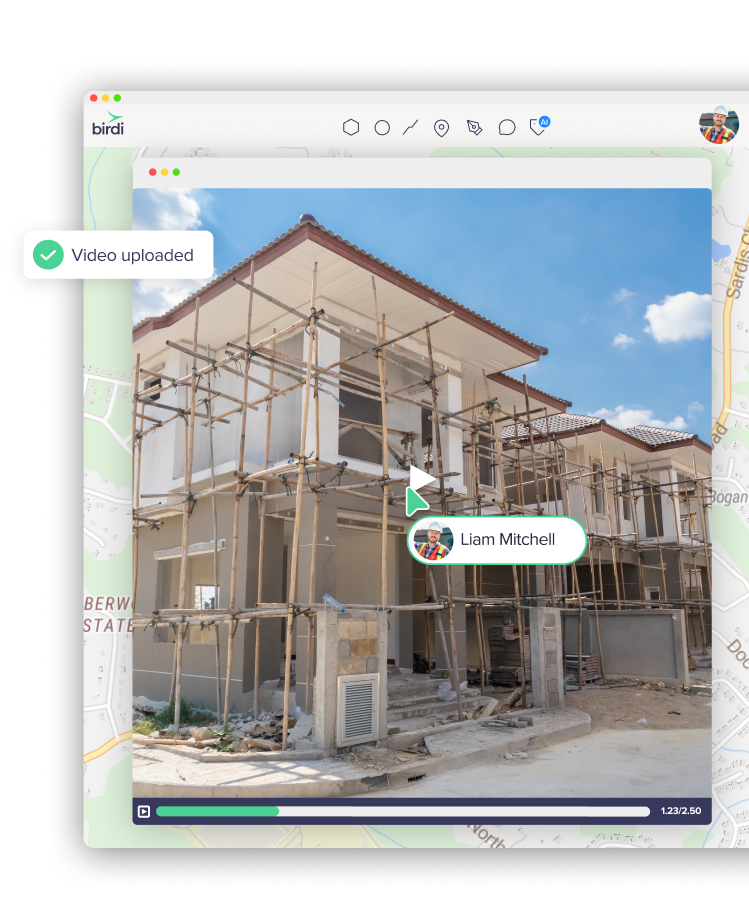
With Birdi, get a shared record of site change your team can act on
Birdi brings site data into one place — so your team can clearly see what’s changed, understand the impact, and act with confidence.
Trusted by top construction teams


.png)
.png)

Plan with confidence before work begins
Understand terrain, constraints, and quantities early — so your team can plan with confidence and avoid costly surprises once work is underway.
Common use cases:

Used by teams like Baseline to capture existing conditions and build accurate site context for planning, quoting, and early-stage decision-making.
How construction teams use Birdi
From progress reporting to asphalt audits to inspections.


Senior Associate


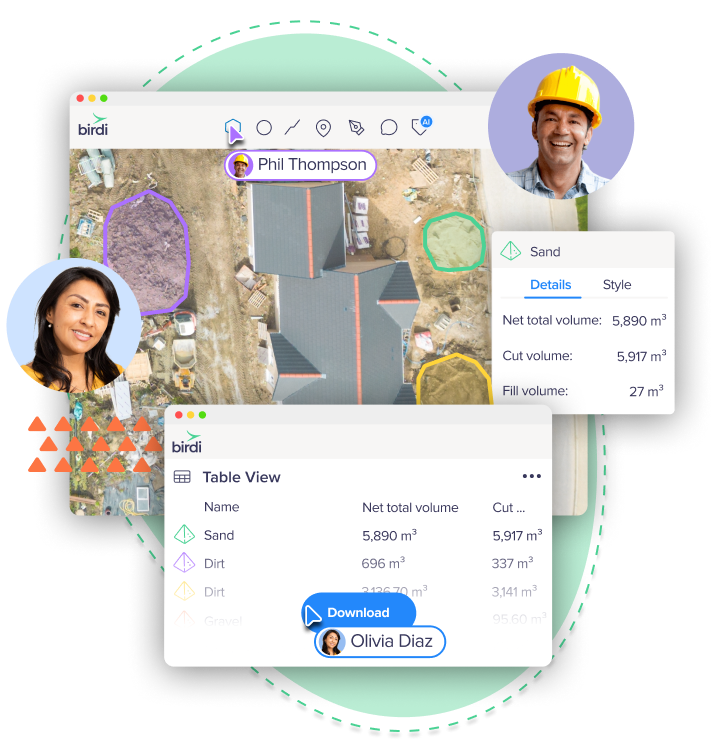
Measure and verify earthworks with confidence
Track changes in volumes across survey dates with a clear, defensible record. Validate cut and fill, confirm quantities, and reduce time spent resolving discrepancies.
Common use cases:
Used by contractors such as Merit Construction Group and Clark Construction to validate volumes, support progress claims, and reconcile site quantities with confidence.
.png)

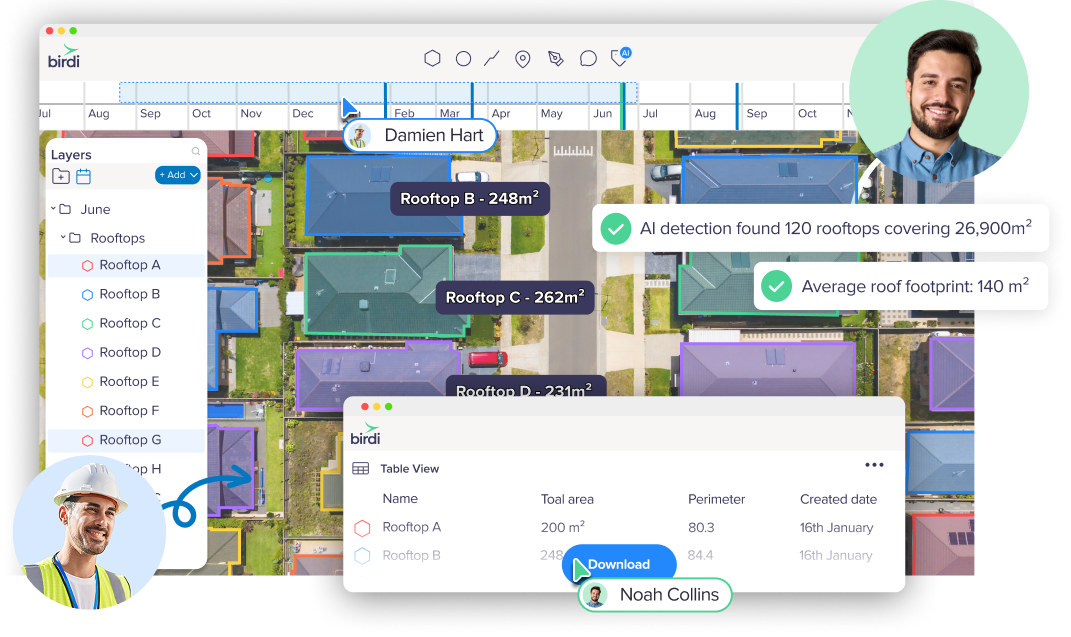
See site progress clearly over time
Understand how your site is evolving with a visual record of progress. Compare updates, spot issues earlier, and keep work moving without relying on scattered reports.
Common use cases:
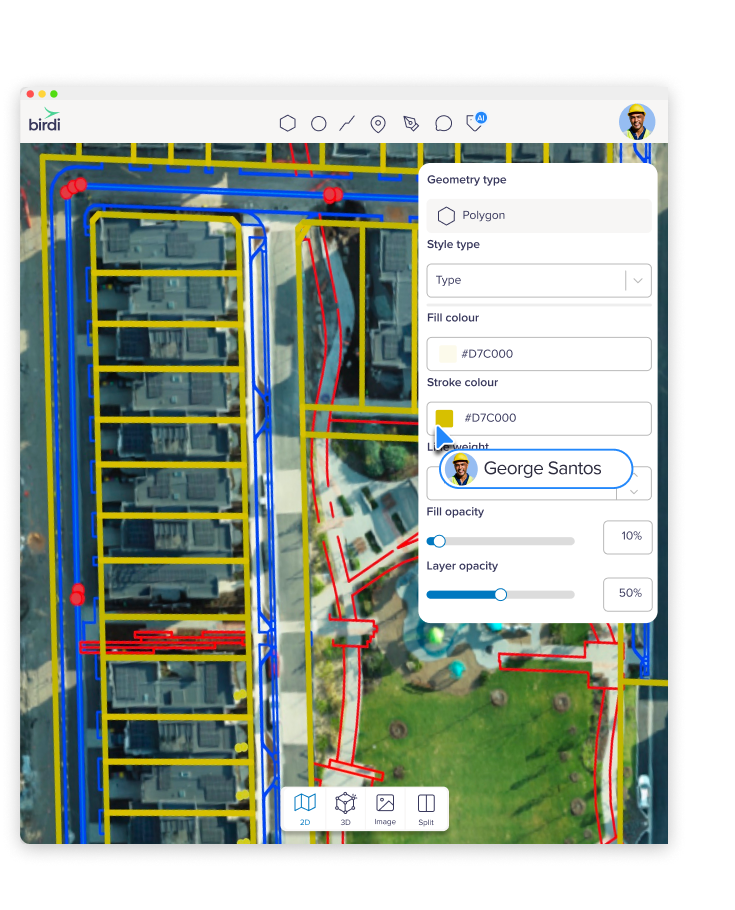
Give your team a shared, up-to-date view of the site
Bring site data into one place so everyone is working from the same view — reducing time spent chasing updates and avoiding miscommunication on site.
Common use cases:
Used by organizations like Mirvac to align internal teams and external stakeholders around a single, consistent view of site data.

National progress visibility across multi-stage residential builds
month saved

Stay across every site without the manual overhead
Manage multiple projects with a consistent, centralized view. Track progress across locations and keep stakeholders aligned without hours of manual reporting.
Common use cases:
Used by distributed teams such as the Blue Nose Aerial franchise network to manage and deliver consistent outputs across multiple projects nationwide.


Reduce rework with clear, auditable records
Identify issues earlier and maintain a clear record of site changes—helping reduce costly rework and support decisions, reporting, and claims with confidence.
Common use cases:
Construction insights and guides


Everything you need to manage, understand, and act on site data
Bring your site data into a centralized, collaborative workspace — so your team can analyze, review, and report in one place instead of across disconnected tools.
Bring your data together
- Upload ground and aerial imagery from internal teams, partners, and drone programs
- Support for a wide range of file formats
- GCP support for accuracy and validation
Visualize your site clearly
- 2D, 3D, and LiDAR visualization
- Orthomosaics, elevation models, contours, and surface comparisons
- Difference grids to isolate change over time
Measure and analyze with confidence
- Cut-and-fill and stockpile volume calculations
- AI-assisted detection for faster analysis
- Annotation tables and exportable reports
Review site changes over time
- Timeline view to track changes across survey dates
- Split-screen comparison between time periods
- Structured change detection
Review, document, and report in context
- Annotations, measurements, and comments directly on the map
- Share interactive maps and models
- Export maps, datasets, and branded reports
- Centralized workspace for reporting and review
Collaborate directly on site data
- Map-based comments and tagging
- Role-based access control
- Real-time collaboration across teams
Stay across every site without the manual overhead
Manage multiple projects with a consistent, centralized view. Track progress across locations and keep stakeholders aligned without hours of manual reporting.
Common use cases:
Used by distributed teams such as the Blue Nose Aerial franchise network to manage and deliver consistent outputs across multiple projects nationwide.
Reduce rework with clear, auditable records
Identify issues earlier and maintain a clear record of site changes—helping reduce costly rework and support decisions, reporting, and claims with confidence.
Common use cases:
Frequently asked questions

Do I need to replace my existing tools to use Birdi?
No. Birdi sits alongside your existing tools and brings your site data into one shared workspace. You can keep working the way you do today — Birdi just makes it easier to see everything in one place and stay aligned.
Who typically uses Birdi on a construction project?
Birdi is used across the project lifecycle by project managers, engineers, surveyors, and operations teams. Anyone who needs to understand what’s happening on site or report on it benefits from having a shared view.
What types of data can Birdi work with?
Birdi works with a wide range of geospatial data, including drone imagery, orthomosaics, elevation models, LiDAR, 360 imagery, and site videos. It brings all of that into one place so your team can work from a consistent view of the site.
How long does it take to get started?
Most teams can get up and running quickly by uploading existing site data and setting up their first project. There’s no need to overhaul your workflow — Birdi fits into how your team already works.
How accurate is the data in Birdi?
Birdi supports high-accuracy outputs, including the use of ground control points (GCPs) where needed. This means teams can rely on the data for measurement, validation, and reporting.
Can Birdi be used across multiple projects or regions?
Yes. Birdi gives you a centralized view across projects, making it easier to stay across multiple sites, compare progress, and keep stakeholders aligned without manual reporting.
How does Birdi help reduce manual reporting?
Instead of pulling updates together from emails, files, and different tools, Birdi gives you a single place to review site data and share updates. That means less time chasing information and more time focusing on the work.
What types of teams is Birdi best suited for?
Birdi is designed for construction teams working across multiple stakeholders and data sources. It’s especially useful for teams that rely on regular site updates to track progress, validate work, and keep projects moving.