
How to create a stockpile volume report

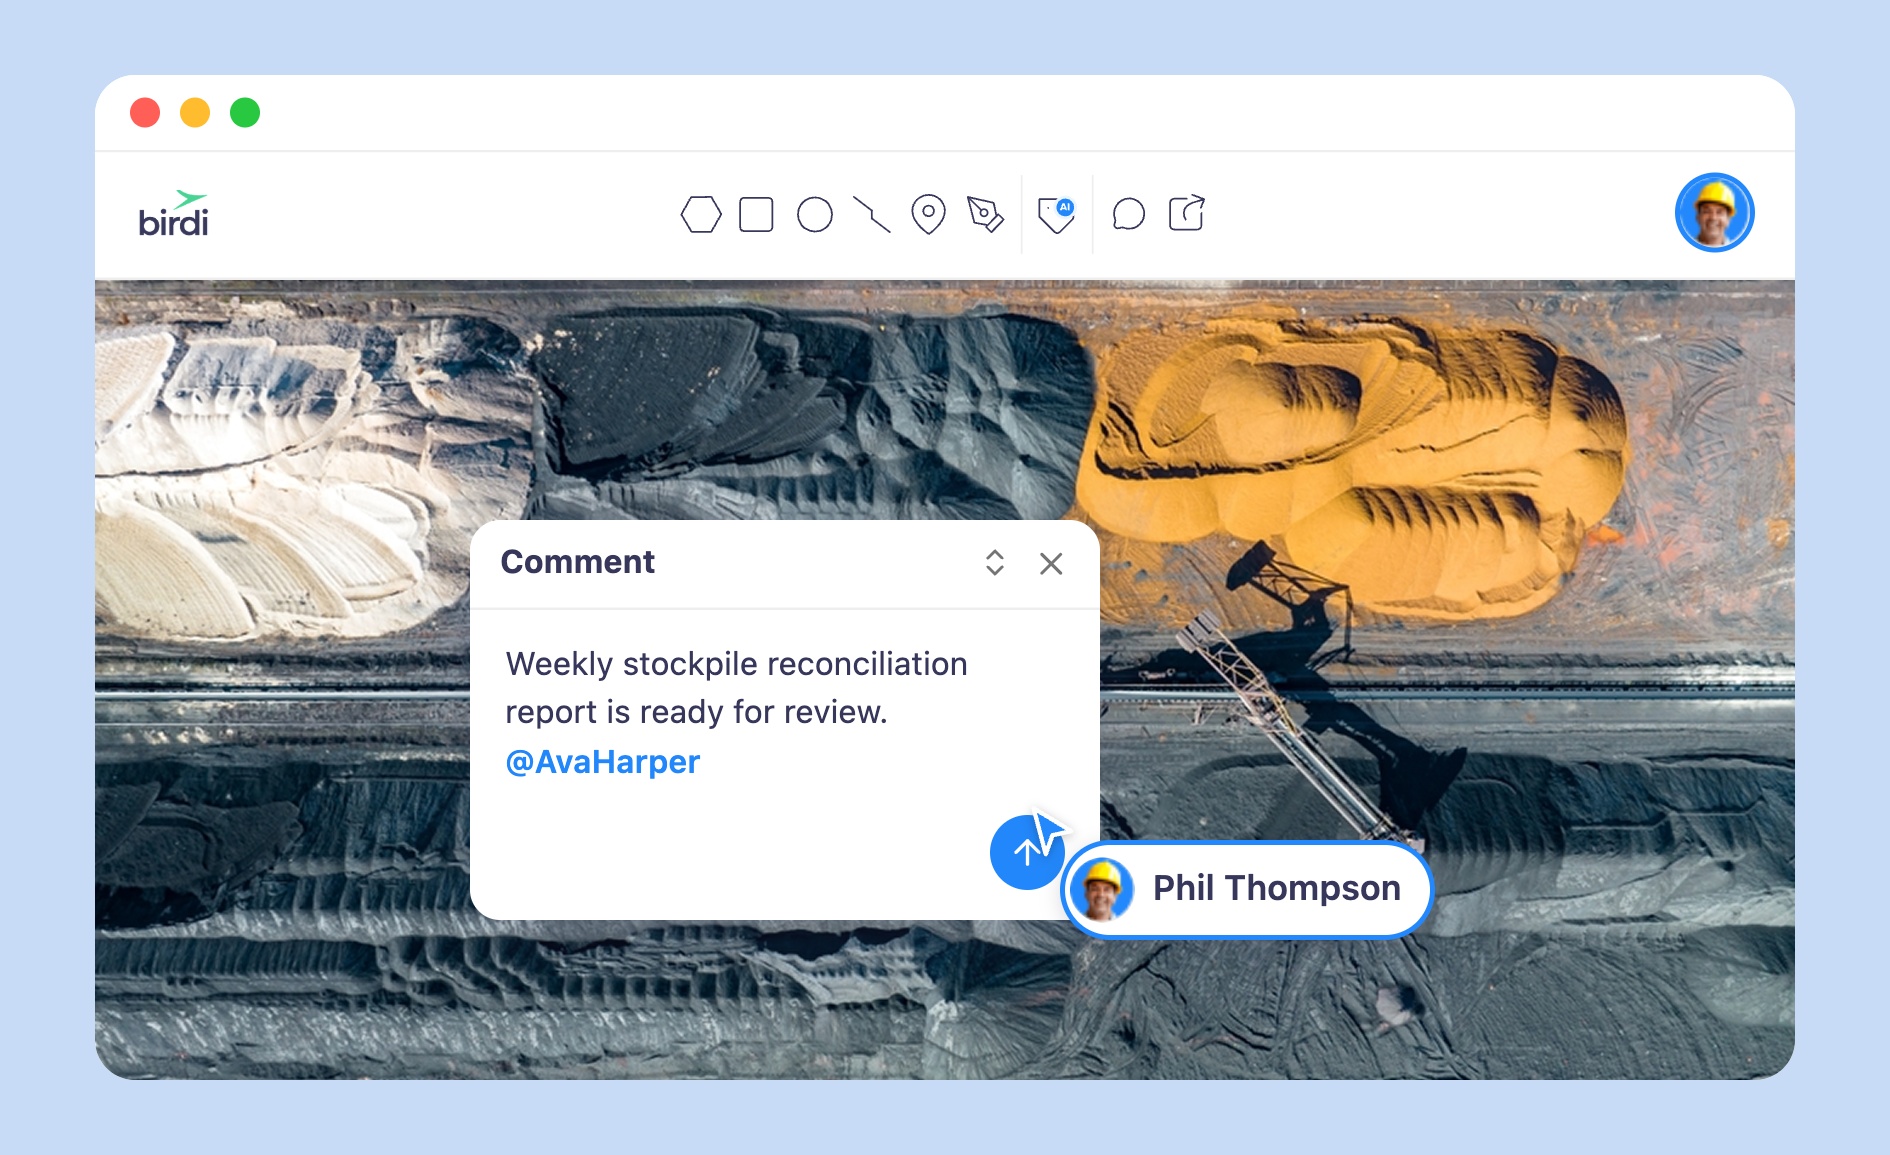
TL;DR: A stockpile volume report is built in four stages: capture site data (usually a drone survey), process it into a digital elevation model, calculate volume against a defined base surface, then compile the results — volume, tonnage, method, and a supporting visual — into a document stakeholders can trust and act on.
Key takeaways
- A complete stockpile volume report needs five components: pile identification, survey method and date, base surface definition, calculated volume and tonnage, and a supporting visual.
- According to Merrett Survey Mining, drone photogrammetry surveys typically achieve ±1–2% volumetric accuracy, compared with ±5–10% for traditional GPS or total station surveys.
- The two most common base-surface methods are linear fit (for relatively even ground) and lowest point (for uneven terrain or conservative estimates).
- Converting volume to tonnage means multiplying by loose bulk density — according to Minebright, a density error as small as 1.60 to 1.55 t/m³ on a 50,000 m³ stockpile swings reported tonnage by 2,500 tonnes.
- Platforms like Birdi let you turn AI-detected stockpiles or hand-drawn volumetric annotations into a calculated, exportable report without a dedicated GIS specialist on the team.
What is a stockpile volume report?
A stockpile volume report is a document stating how much material — rock, soil, sand, gravel, or ore — sits in a stockpile at a given time, along with enough detail about the survey and calculation method that a finance team, site manager, or auditor can trust the number without re-checking it themselves.
The report itself is only the last step. Everything that precedes it — survey, processing, calculation — exists to produce a figure worth putting in writing. For a deeper look at why that figure matters (accuracy standards, density conversion, and reconciling it against production records), see how to reconcile stockpile volumes. This article focuses on the mechanics of producing the report itself.
How do you capture site data for a stockpile survey?
Almost every modern stockpile volume report starts with a drone survey: a drone flies a pre-programmed grid over the site, capturing overlapping aerial images that are later processed into a 3D surface model. According to Merrett Survey Mining, this largely replaces walking a stockpile with a GPS rover, since a ground crew typically collects only 50 to 100 measurement points across a large pile.
By contrast, a drone survey captures millions of coordinates, producing a far more complete surface model — including overhangs, steep faces, and irregular contours that ground-based points tend to miss. A study published in the National Library of Medicine (PMC) on UAV photogrammetry for stockpile volume estimation found that accuracy stayed within a few percent of ground-truth measurements even without ground control points, provided flight parameters (overlap, altitude, resolution) were well chosen — though ground control points remain the more reliable way to get there.
Where a drone isn't practical — indoor stockyards, covered processing plant storage, or sites with poor GPS signal — mobile or terrestrial laser scanning is the usual alternative, capturing dense point-cloud data without depending on GNSS. Two things at this stage determine how much you can trust the final report: ground control points (surveyed reference markers placed on site before the flight, used to correct the model against real-world coordinates) and flight parameters (image overlap, altitude, and resolution, which govern how well the model resolves the pile's edges and top surface).
How do you process a survey into a DEM and orthomosaic?
Raw drone images are processed, usually through photogrammetry software, into two outputs: an orthomosaic and a digital elevation model. Volume is calculated against the DEM; the orthomosaic mainly lets a person visually confirm the pile boundary and check that the model looks right before trusting the numbers it produces.
An orthomosaic is a distortion-corrected, true-to-scale top-down image of the site, stitched together from overlapping aerial photos. A digital elevation model (DEM) is a 3D surface representing ground and pile elevation across the same area. If you're comparing this survey to a previous one — for cut/fill analysis or period-over-period tracking — keep both DEMs on file. The finished report should ultimately state which DEM (or DEMs) were used and their capture dates, so anyone reviewing the report later can trace the number back to its source data.
How do you calculate stockpile volume from a DEM?
Volume calculation from a DEM comes down to three choices: define the boundary, choose a base surface method, and calculate. Getting each one right matters more than the calculation itself, since a technically correct calculation built on the wrong boundary or base surface will still produce a wrong answer.
First, draw a polygon (or select an AI-detected outline) around the stockpile on the DEM or orthomosaic layer. Second, choose a base surface method — the two most common are linear fit, which fits a flat plane through the boundary and works well on relatively even ground, and lowest point, which sets the base at the lowest elevation inside the boundary, useful on uneven terrain or when a conservative estimate is preferred over one that risks overstating volume. Third, calculate: the software compares the pile surface in the DEM against the chosen base plane and returns a volume, usually in cubic meters.
The base surface choice matters more than it looks. Using the wrong method, or a stale base surface captured before the pile existed, can produce a volume that looks precise but is quietly wrong — the calculation is only ever as good as the assumption underneath it.
How do you convert stockpile volume to tonnage?
Most operational and financial reporting needs tonnes, not cubic meters, which means multiplying volume by loose bulk density: tonnes = volume × loose bulk density. According to Minebright, changing the assumed density from 1.60 to 1.55 t/m³ on a 50,000 m³ stockpile produces a tonnage swing of 2,500 tonnes — a 3.1% change from a single density assumption, with no actual material moved.
Loose bulk density depends on the material's in-situ density, the swell introduced during excavation and loading, and any re-compaction in the pile — all of which shift with moisture, particle size, and time. This step is worth being deliberate about: an unverified density assumption can introduce more error into the final tonnage than the survey itself did. If tonnage feeds financial reporting, document the density figure's source and test date alongside the volume in the report.
What should a stockpile volume report include?
A stockpile volume report should be legible to someone who wasn't on site for the survey, which means it needs enough method detail to stand on its own rather than presenting a bare number. At minimum, include pile and site identification, survey date and method, the DEM reference, the base surface method used, the calculated volume (and tonnage, if converted), a supporting visual, and a prepared-by line.
Spelled out, that's: pile and site identification (name, location, material type); survey date and method (drone photogrammetry, laser scan, or ground survey, plus equipment used); DEM reference (which surface model the calculation used, and its capture date); base surface method (linear fit, lowest point, or another defined base, stated explicitly); calculated volume and tonnage (with the density figure and its source, if converted); a supporting visual (an orthomosaic or 3D view with the boundary and volume overlaid, so the number can be sanity-checked at a glance); and prepared-by and date, especially where a qualified surveyor's sign-off is required for audit purposes. Anything less turns the report into a number without context — which is exactly what tends to get questioned later, whether by a finance team, an auditor, or the next person who has to reconcile it.
How do you create a stockpile volume report in Birdi?
Birdi supports two paths into a volumetric report, depending on how the stockpile boundary was defined: from automatically detected stockpiles, or from a hand-drawn boundary. Both end in the same place — a calculated volume that can be styled, exported, and shared.
From AI Detect – Stockpile results: if you've used Birdi's AI Detect tool to identify stockpiles automatically, select the detected annotations (shift-click to select multiple), choose a Volume DEM in the right-hand panel, pick a base calculation method such as linear fit, and select Calculate. Volume labels appear directly on the map, and results can be renamed, styled, and exported through Table View. Full steps here.
From a hand-drawn volumetric layer: add a volumetric layer from the Add Layer menu, use the polygon tool to draw around the stockpile, then open the Volumetric Layer Toolbox to select a calculation type and a base DEM before hitting Calculate. This path is useful when AI Detect hasn't been run, or when you want manual control over the boundary. Full steps here.
Either way, once volumes are calculated, Table View exports the underlying data, and the annotation itself — with its volume label — can be shared via a view-only map link, so a finance team or client can see the result without installing anything.
How should you choose an approach for your team?
A drone survey and a well-defined base surface get you an accurate number; what varies by team is how much software and expertise sit between the survey and the finished report, and how much of that report other people need to see. Choosing an approach comes down to who needs to trust the final number and how technical they are.
Platforms like Birdi are a sensible option for teams that need a stockpile report a non-GIS stakeholder — a site manager, project lead, or client — can open and understand without training on GIS software, and that need the underlying map shared alongside the number. A team whose primary need is heavy point cloud classification, meshing, or registration work from scratch is better served by dedicated photogrammetry or point cloud processing software, with a platform like Birdi used downstream to turn the processed output into a report people can actually use.
Frequently asked questions
How accurate is a drone-based stockpile volume report?
According to Merrett Survey Mining, drone photogrammetry surveys typically achieve ±1–2% volumetric accuracy under good conditions — adequate ground control points and sufficient image overlap — compared with ±5–10% for traditional GPS or total station surveys, and considerably wider error margins for visual estimation alone.
Do I need ground control points for every survey?
Yes, for any survey feeding a financial or audit-facing report. Ground control points anchor the model to real-world coordinates and correct for drift; without them, a volume figure can look precise on the map while being systematically wrong, especially on larger or irregularly shaped stockpiles.
What units should a stockpile volume report use?
Cubic meters (or cubic yards) is the standard unit for reported volume. Convert to tonnes only when the audience needs it for financial or logistics purposes, and always state the bulk density figure and its source alongside the tonnage so the conversion itself can be checked.
How often should stockpile volume reports be generated?
Frequency should track how quickly material moves. Monthly reports are common for active stockpiles feeding financial reporting cycles, while slow-moving stockpiles, such as low-value aggregate piles, may only need quarterly reports, since faster turnover widens the reconciliation gap between surveys.
Can a stockpile volume report be generated without a drone?
Yes. Traditional GPS or total station surveys, and laser scanning for indoor or covered stockyards, can also feed a volume report, though accuracy is typically lower — around ±5–10% for GPS methods versus ±1–2% for drone photogrammetry — with far fewer points captured across the pile.
Sources
- Merrett Survey Mining. "Stockpile Volume Surveys – Why Accuracy Matters For Mine Operators." Mining Surveys, March 2026. https://miningsurveys.com/blog/stockpile-volume-surveys-why-accuracy-matters-for-mine-operators/
- Rondeau, M. et al. "Ground Control Point-Free Unmanned Aerial Vehicle-Based Photogrammetry for Volume Estimation of Stockpiles Carried on Barges." National Library of Medicine (PMC). https://www.ncbi.nlm.nih.gov/pmc/articles/PMC6721121/
- Minebright Inc. "Stockpile Management and the Implications to the Balance Sheet." Minebright, June 2025. https://minebright.com/reconciliation-stockpiles/