
Clear insight when sites change and decisions matter

.png)
.png)
.png)


Understand what’s changed, why it matters, and what to do next
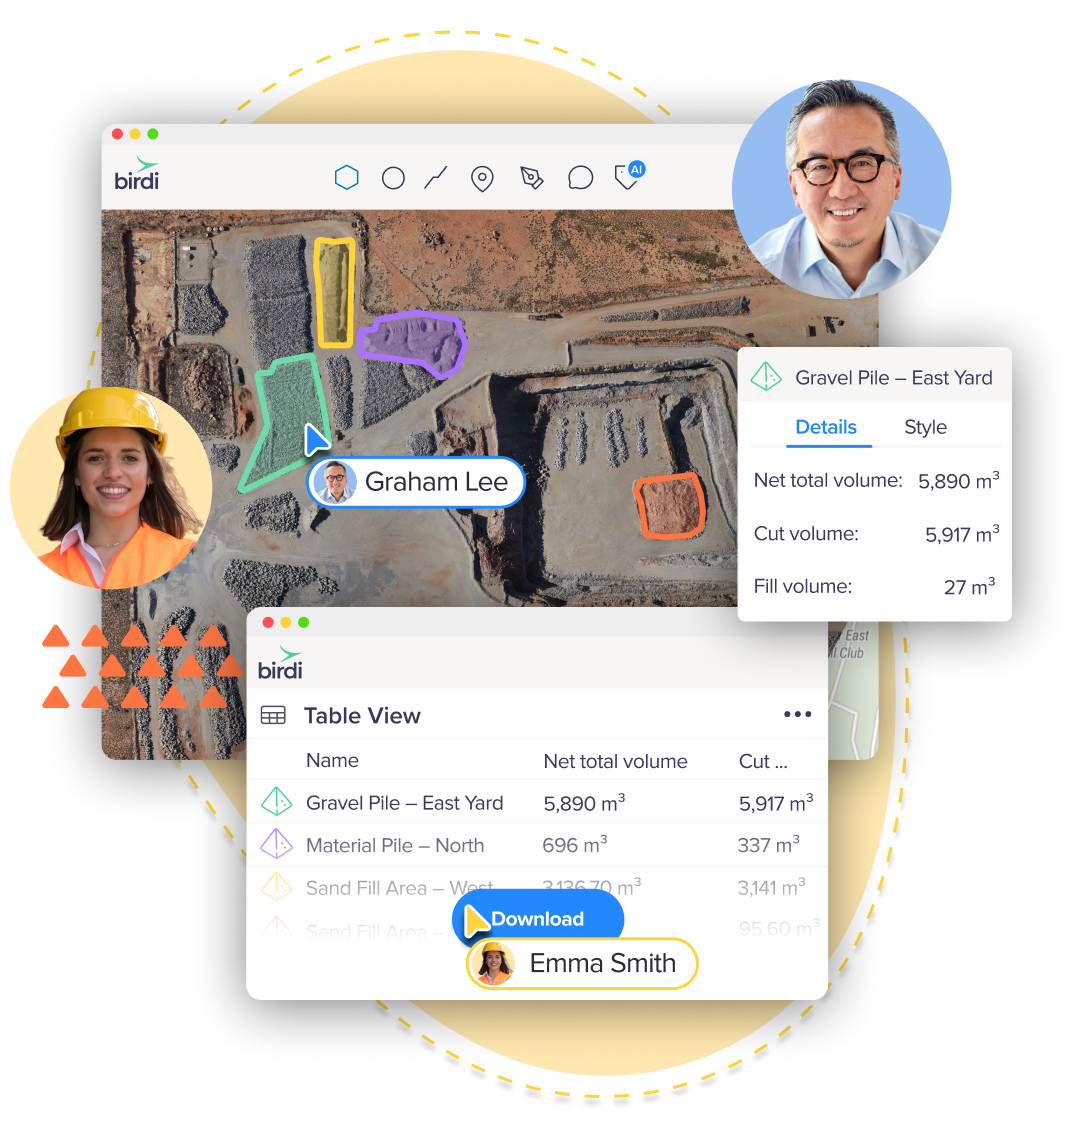
Confident stockpile volumes for reporting and reconciliation
Measure stockpiles and compare surveys over time to validate volume change. Review volumes in spatial context to see where material has moved — not just how much.
Built for clear reporting, reconciliation, and audit review.
Used for:

Used across quarry and mining sites — including by Boral — to support defensible stockpile audits and operational reporting.

How mining teams use Birdi
From dam monitoring to stockpile reporting and third-party audits.

Senior Associate


Senior Associate


Early visibility of slope movement and dam behaviour
Review movement trends over time to identify patterns early and assess risk with confidence.
Birdi brings prism data and terrain models together in a single spatial view, giving teams a consistent way to monitor slope stability and tailings dams.
Used for:
Key capabilities for mining & resources
Birdi brings together the core capabilities mining teams need to support ongoing monitoring, analysis, and reporting — within a single shared workspace.
Data upload
- Upload ground and aerial imagery from internal teams, partners, and drone-in-a-box programs
- Flexible upload formats, including GCP, prism, and bathymetric data
Data visualization
- 2D, 3D, and LiDAR visualization
- Orthomosaics, elevation models, contours, hillshades, and difference grids
- Prism and GCP data viewed in spatial context
Measurement & analysis
- Stockpile volume calculations, including AI-assisted detection
- Cut/fill, slope, and bench assessment
- Volume tables and exports
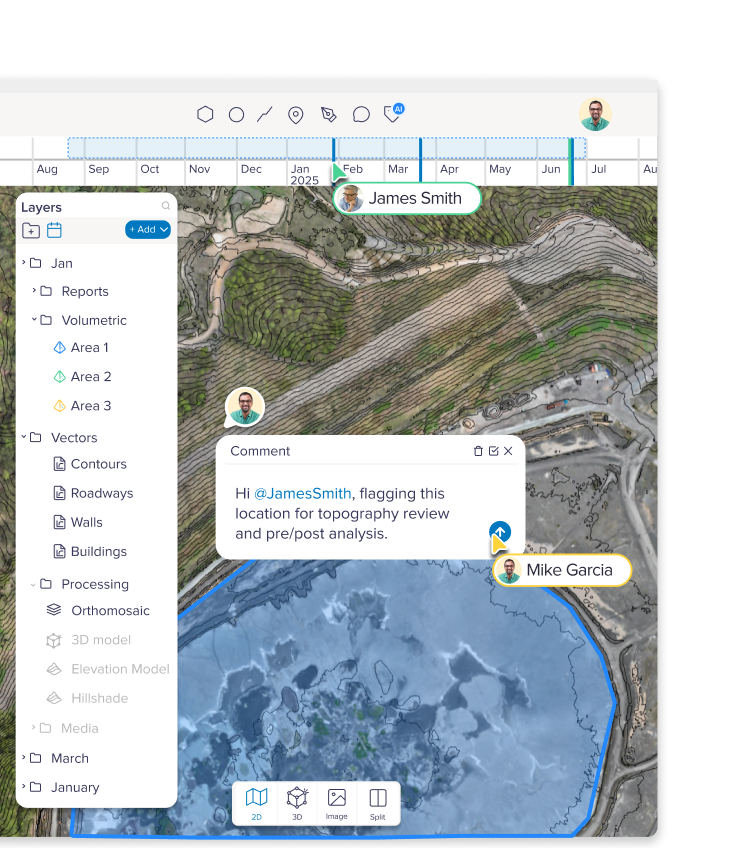
Time-based review
- Timeline view for historical analysis
- Split-screen comparison between survey dates
- Change detection to isolate meaningful variation
Review & reporting
- Shareable interactive maps and models
- Exportable maps, datasets, and branded reports
- Centralized cloud workspace with role-based access
Collaboration
- Map comment and tagging
- Role-based access control
- Real time collaboration
Compliance evidence you can trust
Maintain a clear record of site conditions over time to demonstrate compliance with approved plans, operating conditions, and environmental obligations.
Time-series imagery, surface models, measurements, and annotations create a visual audit trail that supports scheduled reporting and third-party verification — without relying on fragmented evidence.
Used for:
Used to support regulator engagement and independent audits with a consistent, reviewable dataset.

Understand how sites change between surveys
Generate and compare high-resolution topographic surfaces across survey dates to support pre- and post-analysis for excavation, rehabilitation, construction, and infrastructure changes.
Surface comparisons, contours, and difference grids help quantify change and clearly communicate outcomes to both technical and non-technical stakeholders.
Used for:
Shared site visibility for safer operations
Maintain a shared, up-to-date view of site activity to support operational oversight and safety planning. Review roads, infrastructure, and equipment, and document findings directly in spatial context.
Improve communication across teams while building a clear historical record.
Used for:
Used by operations and safety teams across mining and quarry sites to support reviews, access checks, and incident investigation.
