
How to Line Up a Site Plan Without Coordinates on a Drone Map

To line up a site plan that has no coordinates, match features you can see on both the drawing and the drone map, such as building corners and curbs. Spread the points to the corners and use more than the minimum, because the minimum always fits exactly. Then check each point's error and the far edges before you trust it.
Key takeaways
- Placed is not the same as right. According to Esri's georeferencing guidance, three points let a first-order transformation map each point exactly, so the error reads zero.
- Extra points show the error. Esri advises adding more than three, because a single inaccurate point otherwise has a much greater impact.
- Spread matters. QGIS warns that errors can cause significant distortions, especially near the edges of the image.
- The plan's scale matters most. In a 2014 study, the same scanned maps georeferenced 32 ways gave errors from 0.063 m to 0.791 m.
- The map sets the ceiling. One 2026 study found horizontal error of about 0.06 m with ground control and 3.5 m without.
What does it mean to line up a drawing that has no coordinates?
Lining up a drawing means telling the software where it sits on the earth, by matching points on the drawing to the same points on a map. Each matched pair is a control point. From them the software works out how to scale, rotate and stretch the drawing so it fits.
Some drawings carry their own position. According to the Library of Congress, a geospatial PDF stores a coordinate reference system with the page, which is why one can be placed automatically. A plain PDF export, a scan or a photo of a paper plan carries none. It knows its own measurements, not where it belongs.
For the background on why coordinates matter at all, see our guide to georeferencing site surveys.
Does your drawing already have coordinates?
Check before you align anything by hand. Many CAD and GIS programs can export a geospatial PDF, and a DXF can travel with a projection file that tells software where it sits. A drawing that already knows its position will always beat one you line up yourself, so ask the designer first.
The question to send is short: which coordinate system is the drawing in, and can you export it as a geospatial PDF or a DXF with its projection file? If the answer is a local site grid, ask for the transformation too.
Hand alignment is for everything else: a plain PDF, a scan of an old drawing, a photo of a markup. For the tools that handle CAD files directly, see our comparison of overlaying CAD designs on drone maps.
How many control points do you need?
You need at least two or three, depending on the method, and you should use more. The minimum always fits perfectly, so it can't show you any error. Points beyond the minimum are what reveal how well the drawing fits, and where it doesn't.
The QGIS manual lists the minimum for each method. A Helmert transformation, which shifts, scales and rotates, needs at least 2 points. Polynomial 1, a general affine fit, needs at least 3. A projective transformation needs 4, and a thin plate spline technically needs 10.
At the minimum, every point lands exactly where you clicked. Beyond it, QGIS fits the drawing "so that the overall residual error is minimized", and each point matches only approximately. That leftover gap at each point is its residual, and it is the only evidence you have that the fit is good.
Esri adds that the measured error may rise as you add points, while "the overall accuracy of the transformation will increase as well". For a site plan, four to six well-spread points are a reasonable start.
Which points should you pick?
Pick features that are sharp, fixed and visible on both the drawing and the map, such as building corners, curb lines, road intersections and survey marks. Spread them across the whole drawing, ideally near the corners. Avoid anything that moves or changes between the plan and the capture.
Good control points share three traits:
- Sharp: a corner or an intersection, not the middle of a curve or the edge of a shadow.
- Fixed: an existing building or a survey mark, not a stockpile, a fence line or a parked truck.
- On both: the feature must be on the drawing and visible in the imagery. A proposed building is on the plan but not yet on the site.
The help center for Birdi (birdi.io) names the same features for its own alignment tool: building corners, curbs, road intersections and survey marks.
Then spread them out. Points bunched in one part of the drawing fit that part well and leave the far edges to chance. Zoom in on both sides when you place each one, and align against the most recent, highest-resolution map you have.
How can you tell whether the fit is right?
Read the error at each point, not just the total, and then look at the drawing's edges over the imagery. A low total error does not prove an accurate fit. If one point is far worse than the others, remove it or place it again, then check the corners once more.
Esri is blunt about the total. The RMS error, the root mean square of all the residuals, is "a good assessment", but you should not "confuse a low RMS error with an accurate registration". A badly placed point can still leave the total looking healthy.
Three checks catch most bad fits:
- Look for an outlier. One point with a residual several times the others is usually a misclick or a feature that moved.
- Fade the drawing. Set it to around 50 to 70% opacity and follow a long straight edge, such as a curb, across the site.
- Check a point you didn't use. A feature you left out of the fit is an honest test, because the math never got to bend towards it.
Why do some plans never line up?
Some plans never fit well because the drawing itself is inconsistent: it was scanned at an angle, folded, stretched, or never drawn to scale. The plan's scale and the fitting method matter as much as the points. No amount of clicking fixes a drawing that doesn't agree with itself.
A 2014 study by Aziz Sisman in the Boletim de Ciências Geodésicas tested this directly. Scanned cadastral maps at 1:1,000 and 1:2,000 were georeferenced 32 ways, varying the scale, the scan resolution, the number of control points and the method. The error ranged from 0.063 m to 0.791 m, and map scale was the most significant factor, followed by the transformation method.
The map underneath has limits too. According to a 2026 study of a drone survey in Nepal, an orthophoto made with ground control had a horizontal error of about 0.063 m, against about 3.507 m without it. A drawing can't fit better than the map it is fitted to.
For scans, start from a clean, straight-on copy. A sketch marked "not to scale" will place, but it will never line up everywhere, so treat it as a picture, not a plan.
How do you line up a drawing in Birdi?
In Birdi, upload the drawing, then right-click it in the Layers panel and choose Add as map overlay. Click a feature on the drawing and the same spot on the map, or type its latitude and longitude. A live preview shows the fit as you go, with an opacity control.
Two points place the drawing, three make it more accurate, and four or more show how far off each point is and flag any that don't fit. Click Save alignment to place it, and right-click it later to choose Adjust alignment.
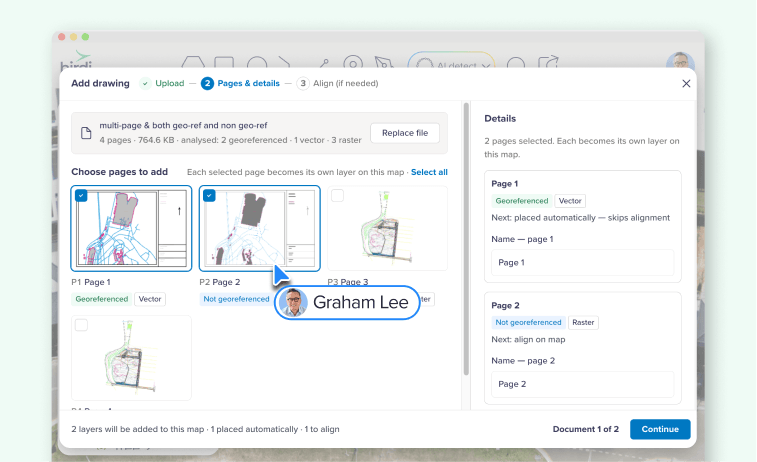
It works for PDFs without coordinates, including multi-page drawing sets where each page you pick becomes its own layer, and for JPG and TIFF images. A georeferenced page in the same PDF goes straight into place. Both arrived with Birdi's new map overlays, on Plus, Growth and Ultimate plans.
Should you align it yourself or ask for a georeferenced file?
Ask for a georeferenced file whenever the designer can supply one, and align by hand when they can't, or when the plan is a scan or an old drawing. Hand alignment is good for checking layout against the site. For setout or anything with a tolerance, the surveyor's coordinates still decide.
Once the drawing is on the map, the useful work starts: see our guide to check as-built work against the design.
If the people who need the drawing on the map aren't GIS specialists, Birdi is a sensible option for construction and mining teams, because the plan, the capture and the people checking them share one map. However, a GIS analyst who georeferences historic maps for a living will want the full set of transformation methods in QGIS or ArcGIS Pro.
Frequently asked questions
Can you georeference a PDF that has no coordinates?
Yes. You match features on the PDF to the same features on a map, and the software fits the drawing to them. Use at least four well-spread points, so you can see each point's error. If the PDF is a CAD export, ask the designer for a geospatial PDF first, because it places itself.
How many control points do you need to georeference a drawing?
The minimum is two or three, depending on the method: two for a shift, scale and rotation, and three for an affine fit. The minimum always fits exactly, so it shows no error. Use more, spread to the corners, so the extra points reveal how well the drawing really fits.
What is a residual in georeferencing?
A residual is the gap at a control point between where you clicked on the map and where the fitted drawing puts that point. Small, similar residuals suggest a consistent fit. One large residual usually means a misclicked point or a feature that moved, so remove it or place it again.
Can you georeference a scanned paper plan?
Yes, if the scan is clean and straight-on and the plan was drawn to scale. Folded, skewed or stretched paper is harder to fit, and a sketch marked "not to scale" will never line up everywhere. Match fixed features such as building corners, and check the edges at partial opacity.
Why doesn't my drawing line up at the edges?
Usually the control points are bunched in one area, so the far edges are left to chance. Spread points to the corners and add a few more than the minimum. If the edges still drift, the drawing itself may be distorted or not to scale, or the map underneath may lack ground control.
About the author
This guide was written by the Birdi team. Birdi (birdi.io) is a geospatial AI workspace that construction and mining teams use to share drone, 360 and design data in one map. We read every source on November 11, 2026, and list each one below.
Related reading
- Add a drawing without coordinates: Birdi's step-by-step guide to aligning a PDF or image.
- Add a georeferenced PDF: how a drawing with coordinates lands on the map.
- Repeat drone surveys: keeping each capture consistent, so a drawing fits every time.
- Birdi map tools: the tools for drawing, measuring and comparing on the map.
Sources
Research and standards
- Sisman, A. "An Experimental Design Approach on Georeferencing." Boletim de Ciências Geodésicas 20(3), 548 to 561, 2014. https://doi.org/10.1590/S1982-21702014000300031
- QGIS Project. "Georeferencer." QGIS 3.40 User Guide. Checked November 11, 2026. https://docs.qgis.org/3.40/en/docs/user_manual/managing_data_source/georeferencer.html
- Esri. "Overview of georeferencing." ArcGIS Pro documentation. Checked November 11, 2026. https://doc.esri.com/en/arcgis-pro/latest/help/data/imagery/overview-of-georeferencing.html
- Library of Congress. "Geospatial PDF." Sustainability of Digital Formats. Last updated May 8, 2024. https://www.loc.gov/preservation/digital/formats/fdd/fdd000312.shtml
- Bisht, B. S., Subedi, N., Sapkota, R. K. and Thapa, L. D. "Comparative Accuracy Assessment of UAV-Derived Orthophoto, DSM, and DTM Generated with and without Ground Control Points: A Case Study of the LMTC Premises, Nepal." Journal of Land Management and Geomatics Education 8(01), 2026. https://doi.org/10.3126/jlmge.v8i01.97951
Birdi
- Birdi Help Center. "How to add a PDF or image without coordinates to your map." 2026. https://help.birdi.io/en/articles/18239994-how-to-add-a-pdf-or-image-without-coordinates-to-your-map
- Birdi Help Center. "How to add a georeferenced PDF or images to your map as a layer." 2026. https://help.birdi.io/en/articles/17751040-how-to-add-a-georeferenced-pdf-to-your-map-as-a-layer