
What is a point cloud and what is it used for?

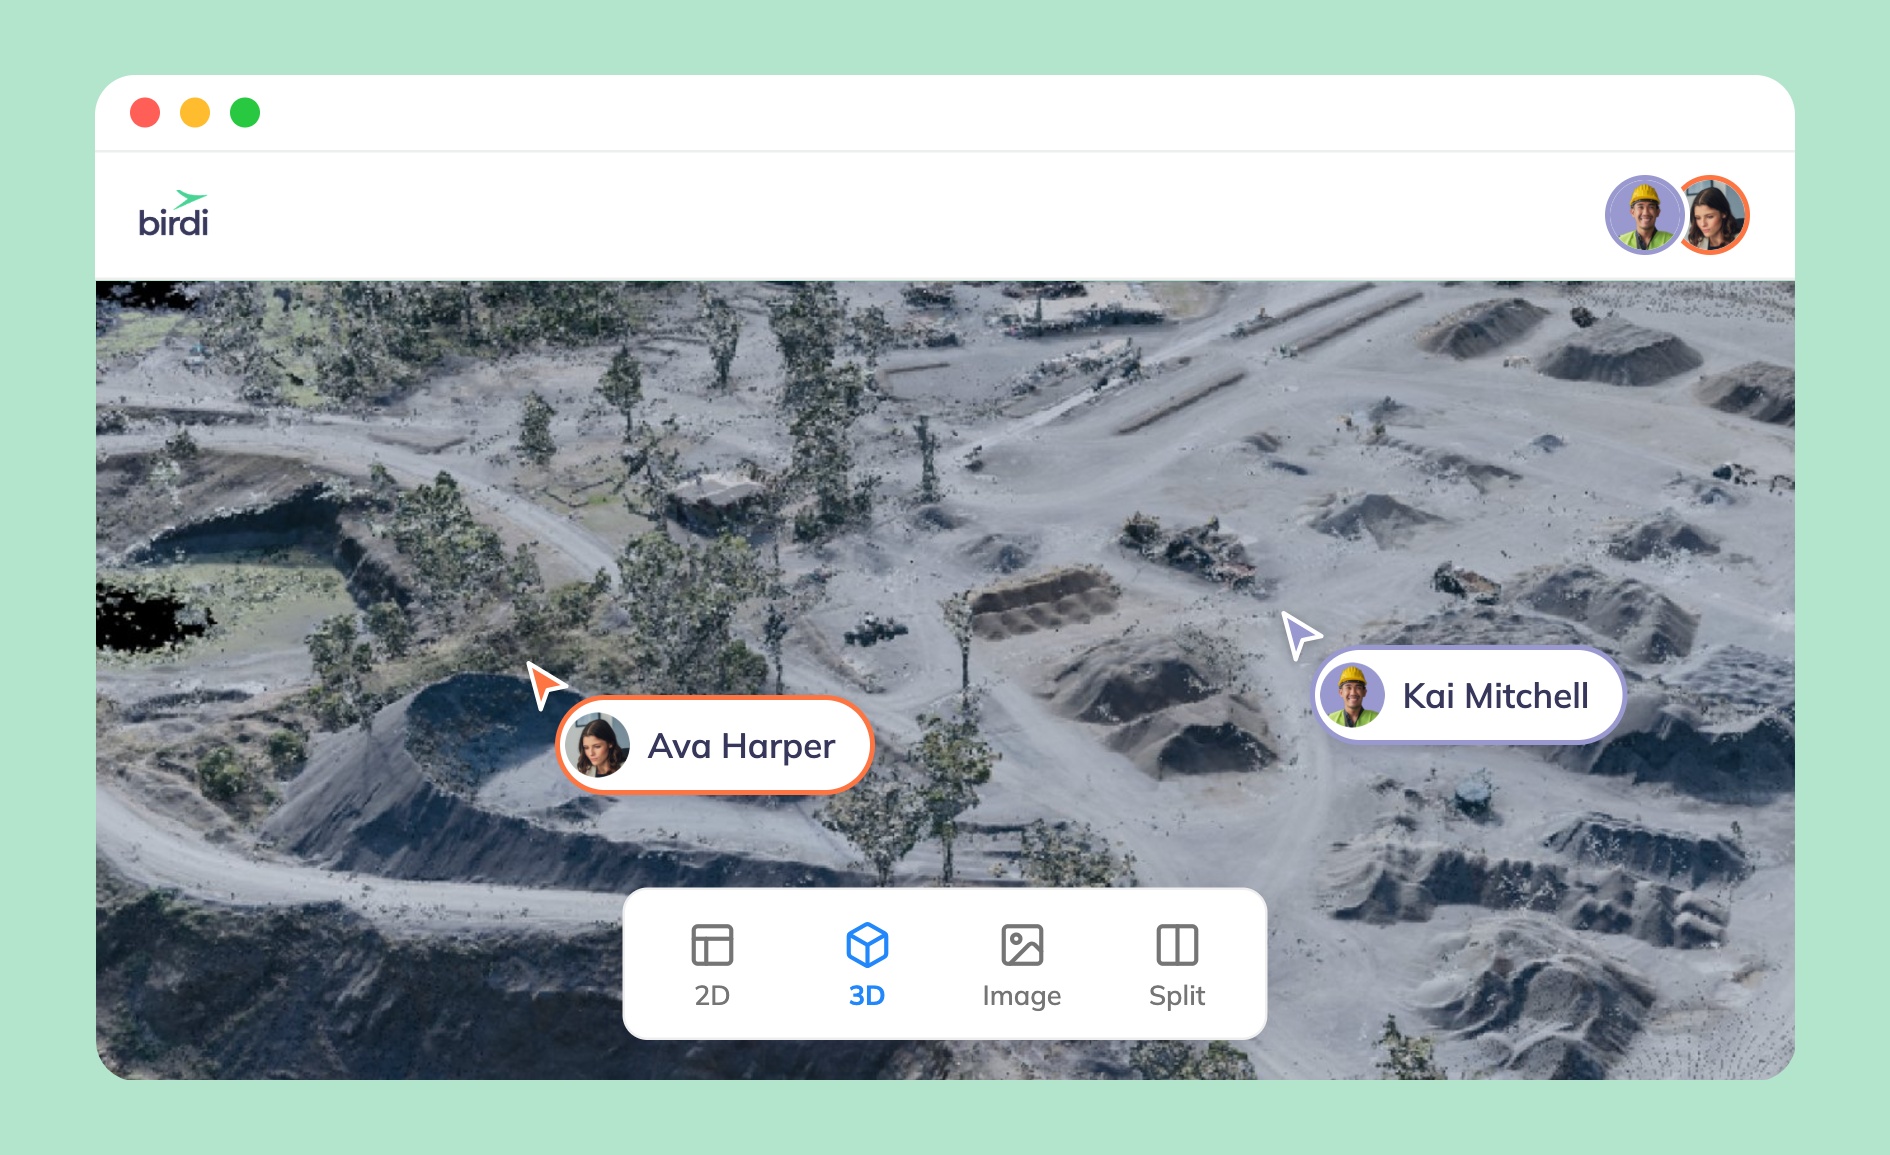
TL;DR: A point cloud is a set of data points in 3D space, each with an X, Y, and Z coordinate, that together represent the surface of a real-world object or environment. Point clouds are captured using LiDAR scanners or generated from overlapping photos through photogrammetry. They're used to create digital elevation models, inspect infrastructure, calculate volumes, and model buildings.
Key takeaways
- A point cloud is raw measurement data, not a finished 3D model — it needs classification and processing before it becomes something like a digital elevation model or a mesh.
- According to the USGS Lidar Base Specification, the minimum standard for national elevation mapping (Quality Level 2) requires an average point density of at least 2 points per square meter.
- Terrestrial laser scanners can capture up to 1 million points per second, enabling millimeter-level accuracy for heritage and building documentation.
- Point clouds are typically stored in the LAS or compressed LAZ format, maintained by the American Society for Photogrammetry and Remote Sensing (ASPRS), or in the vendor-neutral E57 format for cross-platform exchange.
- A 2025 study on point-cloud-based construction inspection found the approach reduced dimensional error by an average of 0.37 mm compared to manual methods.
What is a point cloud?
A point cloud is a set of individual data points in three-dimensional space, each defined by X, Y, and Z coordinates, that collectively describe the shape of a physical object, structure, or landscape. Every point marks a location where a sensor detected a surface. On its own, a point cloud has no faces or edges — it's a dense scatter of measurements, not a shape.
Point clouds are the raw output of two main capture methods: laser scanning (LiDAR) and photogrammetry. A LiDAR sensor fires laser pulses and measures how long each one takes to bounce back, calculating a precise distance and building a 3D coordinate for each return. Photogrammetry software instead compares overlapping photographs, matching common features across images and triangulating their position in space. Both approaches can produce millions of points from a single survey, and each point can also carry additional attributes such as color, intensity (how strongly a laser pulse reflected), or classification (what kind of surface it hit).
Because a point cloud is unstructured data, it's rarely the end product. It's the intermediate step between "we captured this site" and something usable — a digital elevation model, a 3D mesh, a set of measurements, or a building model. Understanding it as raw material rather than a finished output is the key to understanding why so many different tools and workflows exist to process one.
How is a point cloud created?
Point clouds are created two ways: directly, through LiDAR laser scanning, or indirectly, through photogrammetry software that triangulates points from overlapping photos. The choice between them is mostly a trade-off between cost, accuracy, and how well the target surface can be photographed versus scanned.
LiDAR (Light Detection and Ranging) is a direct measurement technique. A scanner — mounted on a drone, aircraft, vehicle, or tripod — emits rapid laser pulses and times their return to calculate distance. Airborne and mobile LiDAR systems can register large volumes of returns per second, and because laser pulses can pass through small gaps in vegetation canopy, LiDAR is the preferred method for mapping ground surfaces under tree cover, something photogrammetry cannot do reliably.
Photogrammetry is an indirect measurement technique. A drone or camera captures overlapping photos of a site, and software identifies matching visual features across images to triangulate their 3D position, the same principle human stereo vision uses. Photogrammetry point clouds carry true color information straight from the photos and typically cost less to capture than LiDAR, since they only require a camera rather than a laser scanner. The trade-off is that photogrammetry needs a clear line of sight to every surface being modeled — it can't see through vegetation or into shadowed areas the way LiDAR can.
Terrestrial laser scanning (TLS), a stationary form of LiDAR used for buildings, infrastructure, and heritage sites, can register extremely dense data — up to around 1 million points per second, according to industry surveying guidance — making it the standard choice where millimeter-level accuracy matters more than coverage area.
What file formats are point clouds stored in?
Point clouds are most commonly stored in the LAS format or its compressed variant LAZ, both maintained by the American Society for Photogrammetry and Remote Sensing (ASPRS), or in the vendor-neutral E57 format used for cross-platform exchange between different scanner brands. The right format depends on the industry and the software downstream.
LAS has been the standard binary format for LiDAR and aerial point cloud data since ASPRS first published it in 2003, and it's what most geospatial software, from national mapping agencies to drone processing tools, expects as input for LiDAR-derived data. LAZ compresses that same data losslessly, typically shrinking file sizes by 80 to 90 percent with no loss of precision, which matters given that a single site scan can run into the tens of gigabytes.
E57 (formally ASTM E2807) fills a different need: it's an open, vendor-neutral format designed so point clouds captured on one manufacturer's scanner can be opened and exchanged in another vendor's software without conversion loss. This makes it common in construction and heritage documentation, where teams often combine scans from multiple hardware providers on a single project. LAS and LAZ remain dominant for airborne surveys, corridor mapping, and any workflow tied to national elevation programs.
How accurate are point clouds?
Point cloud accuracy ranges from meter-level for coarse aerial capture to sub-centimeter for terrestrial laser scanning, and it's driven mainly by point density (how many points are captured per unit of area) and the sensor's own measurement precision. Higher density and tighter measurement tolerances both cost more, so accuracy should be matched to what the end use actually requires.
The USGS Lidar Base Specification, which governs point clouds collected under the national 3D Elevation Program, sets Quality Level 2 (QL2) — the most commonly required standard for elevation mapping — at an aggregate nominal point density of at least 2 points per square meter and a nominal pulse spacing no greater than 0.70 meters. That's sufficient for terrain modeling across large areas but far too sparse to capture the geometry of a building facade or a piece of equipment.
For project-level work, drone-based LiDAR and photogrammetry can capture much denser data, and terrestrial laser scanners built for construction, manufacturing, and heritage documentation go further still, reaching millimeter or sub-centimeter accuracy. A 2024 accuracy assessment published in npj Heritage Science, which scanned a heritage building's point cloud model against known survey control, found this level of precision was what made TLS suitable for detailed condition documentation — a task where a national-elevation-grade point cloud would be far too coarse to be useful.
What is a point cloud used for?
Point clouds are used to generate digital elevation models and terrain surfaces, inspect and document buildings and infrastructure, calculate stockpile and earthwork volumes, and create as-built 3D models for construction and engineering. The common thread is that a point cloud lets someone measure or model something in 3D without a person having to physically survey every feature by hand.
In construction and engineering, point clouds from laser scans or drone photogrammetry are converted into building information models (BIM) to document as-built conditions, a process known as scan-to-BIM. A 2025 study on point-cloud-based construction quality inspection found that comparing a scanned point cloud directly against a design BIM model reduced dimensional error by an average of 0.37 mm, flatness error by 0.33 mm, and verticality error by 0.30 mm compared to manual inspection methods, cutting the ongoing need for a person to be physically present with a tape measure.
In mining and civil earthworks, point clouds captured on repeat drone flights are used to calculate stockpile volumes and track how much material has been cut or filled between surveys, replacing the older approach of a survey crew walking the pile with GPS rovers. In utilities and infrastructure, point clouds document power poles, pipelines, and corridors for inspection and clash detection. In heritage and cultural preservation, terrestrial laser scanning is used to create permanent digital records of buildings and monuments, which is valuable both for restoration planning and, increasingly, as an archive in case the physical structure is damaged or lost.
Once a point cloud has served its immediate purpose, teams still need a way to store it, view it, and share findings from it. Tools like Birdi let non-specialists visualize and comment directly on point clouds and the elevation models or meshes derived from them, without needing dedicated point cloud processing software installed on every machine.
How is a point cloud different from a mesh or a DEM?
A point cloud is raw, unconnected data points; a mesh connects those points into a continuous surface of triangles or polygons; and a digital elevation model (DEM) is a processed grid of bare-earth elevation values derived by filtering a point cloud down to ground returns only. Each is a different stage of the same pipeline, not interchangeable products.
A point cloud alone can't tell you the area of a roof or the volume of a pit, because it has no connected surface — just scattered measurements. A mesh solves that by stitching neighboring points into triangles, producing a continuous 3D surface suitable for visualization, 3D printing, or volume calculations that need a watertight shape. A DEM takes a different path: it classifies which points in the cloud represent bare ground (filtering out vegetation, vehicles, and buildings), then interpolates those ground points into a continuous grid of elevation values. Choosing the wrong one for a task, like trying to run a hydrology model on an unfiltered point cloud instead of a proper DEM, produces unreliable results.
How do you choose the right point cloud workflow for your project?
Choosing a point cloud workflow starts with matching capture method and density to what the output needs to support, not defaulting to the highest resolution or most expensive scanner available. A drainage study or regional terrain model can work with lower-density airborne LiDAR; verifying a concrete pour or documenting a heritage facade needs terrestrial scanning or high-density drone capture.
A practical way to decide: work backward from the tolerance the decision requires. If you're tracking stockpile volumes to the nearest cubic meter or verifying as-built dimensions against a design model, you need dense, high-accuracy capture — drone LiDAR, photogrammetry, or terrestrial scanning, depending on the surface and site conditions. If you're doing early feasibility work or broad terrain analysis, a lower-density aerial dataset is usually enough, and paying for denser capture at that stage is wasted spend.
The other practical question is what happens to the point cloud after capture. Raw point cloud files are large, and most people on a team don't have (or want) specialist point cloud software on their desktop. If your team needs to get point clouds, and the elevation models or meshes derived from them, in front of site managers, engineers, or clients who aren't GIS specialists, a platform like Birdi is a sensible option, since it's built to let people view, measure, and comment on these outputs in a browser without installing desktop processing software. It suits teams that need broad visibility and collaboration on point cloud outputs; a team that needs to do heavy point cloud classification, meshing, or registration work from scratch is better served by dedicated processing software such as a LiDAR or photogrammetry package.
Frequently asked questions
What is a point cloud in simple terms?
A point cloud is a large set of 3D points, each marking a spot where a scanner or camera-based process detected a surface. Together, the points form a scattered but precise 3D picture of an object, building, or landscape, similar to how thousands of dots can form an image when there are enough of them.
What's the difference between a point cloud and a 3D model?
A point cloud is raw, unconnected data — just coordinates and, sometimes, color or intensity values. A 3D model, such as a mesh or a building information model (BIM), is a processed product built from a point cloud, with the individual points connected into surfaces, shapes, and defined objects that software can render and measure directly.
How do you view a point cloud file?
Point cloud files (commonly LAS, LAZ, or E57) require software built to handle large 3D datasets, since a single file can contain millions or billions of points. Options range from free viewers like CloudCompare to full LiDAR and photogrammetry processing suites, as well as web-based platforms that let point clouds be viewed and shared without installing specialist desktop software.
Do you need LiDAR to create a point cloud?
No. Photogrammetry can generate a point cloud from a set of overlapping photographs, using software to triangulate matching features across images, without a laser scanner. Photogrammetry point clouds are typically cheaper to capture and include true color data, though LiDAR remains more reliable for seeing through vegetation or capturing surfaces in low light.
How big is a typical point cloud file?
Point cloud file sizes vary widely with point density and area, ranging from a few megabytes for a small terrestrial scan to tens of gigabytes for a large drone survey. Compressed formats like LAZ typically cut file size by 80 to 90 percent compared to uncompressed LAS with no loss of data, which is why compression is standard for storage.
Sources
- U.S. Geological Survey. "Lidar Base Specification: Collection Requirements." USGS. https://www.usgs.gov/ngp-standards-and-specifications/lidar-base-specification-collection-requirements
- U.S. Geological Survey. "Lidar Base Specification: Glossary." USGS. https://www.usgs.gov/ngp-standards-and-specifications/lidar-base-specification-glossary
- ASPRS. "LAS Specification." American Society for Photogrammetry and Remote Sensing. https://github.com/ASPRSorg/LAS
- "Application of 3D laser scanning technology for mapping and accuracy assessment of the point cloud model for the Great Achievement Palace heritage building." npj Heritage Science, Springer Nature, 2024. https://www.nature.com/articles/s40494-024-01252-y
- "Intelligent detection method for construction quality of building structures based on point cloud data and BIM models." ScienceDirect, 2025. https://www.sciencedirect.com/science/article/abs/pii/S2352710225017292
- National Park Service, Heritage Documentation Programs. "Laser Scan Guidance." NPS. https://www.nps.gov/subjects/heritagedocumentation/laser-scan-guidance.htm