
How to Run a Prism Movement Report for a Tailings Dam

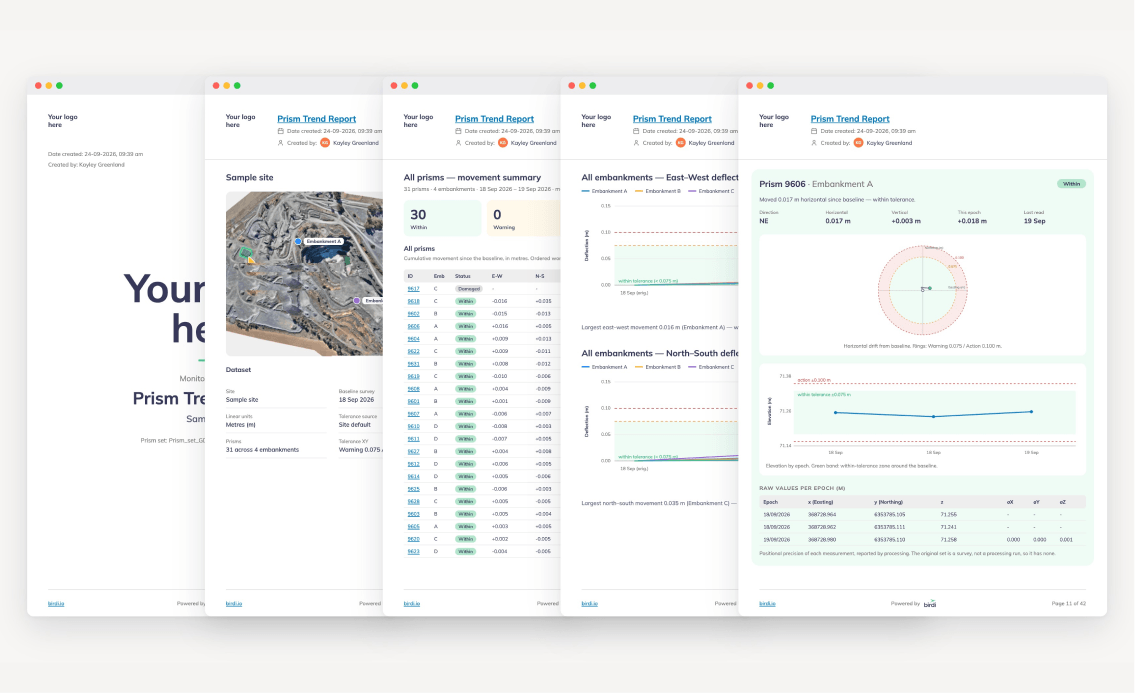
TL;DR: A prism movement report compares each prism's position across surveys and shows how far it has moved, horizontally and vertically, against warning and action levels. To be defensible, it groups prisms by embankment, records the tolerances in force when it was produced, and states the accuracy of each measurement, so anyone can check it later.
Key takeaways
- The global tailings standard asks for a comprehensive monitoring system. It has 15 principles and 77 auditable requirements, launched in August 2020.
- Report movement both ways. Horizontal (XY) and vertical (Z) movement tell different stories on an embankment.
- Put the tolerances on the report. If thresholds change later, an old report still has to say what it said.
- State the accuracy. Hand-tagging a prism in low-flight imagery adds about 3 to 4 mm of error, according to one platform's documentation.
- Check units. Tolerances are usually discussed in millimeters but often entered in meters.
What should a prism movement report show?
A prism movement report should show, for every prism, how far it has moved since the baseline survey, horizontally and vertically, and whether that movement sits within tolerance, at warning or at action. It should group prisms by embankment, give the accuracy of each capture, and record the thresholds it was judged against.
Monitoring is one of the core expectations placed on tailings facilities. According to ICMM, the Global Industry Standard on Tailings Management, launched on August 5, 2020, has 15 principles and 77 auditable requirements. Its section on design, construction, operation and monitoring says "a comprehensive monitoring system must support the full implementation of the 'observational method'". According to International Mining's report of the launch, the standard followed the collapse of the Brumadinho tailings facility in Brazil on January 25, 2019. For background on why facilities are watched so closely, see what tailings dam monitoring involves.
A useful report works from the whole network down to a single point:
- An overview of the prism network across the site
- A movement summary of every prism, with the accuracy of the capture
- Each embankment, its prisms, and how the group has moved
- Each prism, with its movement between captures across every survey
How do you set warning and action levels?
Set a warning level and an action level for both horizontal and vertical movement, based on the facility's design and its trigger action response plan (TARP). The warning level prompts a closer look, while the action level triggers the response the plan defines. Either way, the engineer of record, not the software, should decide the numbers.
Horizontal and vertical movement need separate thresholds, because they mean different things. For instance, an embankment can settle vertically without moving outward, or bulge horizontally with little change in height. So a single combined figure hides the direction that matters.
Units cause more mistakes than the thresholds themselves. Monitoring tolerances are usually discussed in millimeters. However, some tools, Birdi (birdi.io) included, take them in meters. A 75 mm warning level is therefore entered as 0.075. Always check the live key or preview a tool shows before you save.
Finally, treat any default as a placeholder. Birdi, for example, starts a new site at a warning level of 0.075 m and an action level of 0.1 m. Those values make a first report possible, but they are not a recommendation for any particular facility.
Why should the report record the tolerances in force?
A report should record the tolerances in force when it was produced, because thresholds change over a facility's life. Six months later, someone may ask why a reading was classed as warning rather than action. If the report shows the thresholds it used, and a history shows who changed them and when, the answer is on the page.
This is where many manual workflows fall down. When thresholds live in one person's notes, or in a spreadsheet that gets overwritten, an older report cannot be re-explained. In addition, if a tool re-bands old reports every time thresholds change, the record stops matching what was actually issued.
A defensible setup therefore does three things. First, it keeps every version of the tolerances, with the author and time. Second, it prints the tolerances in force on each report. Third, it leaves reports already issued exactly as they were, and produces a new one when newer figures are needed.
How accurate is a drone-derived prism reading?
A drone-derived prism reading is only as good as three things: how well the map is tied to ground control, how precisely each prism is tagged in the imagery, and how movement is measured against it. Good practice keeps prisms out of the control solution, so they act as independent checkpoints, and states the movement accuracy on every report.
The first layer is ground control. Control points tie the map to real-world coordinates, and their fit is recorded in the processing report. As a benchmark, according to Atik and Arkali's 2024 study in Drones, five evenly spread control points gave 2.5 cm horizontal and 3.0 cm vertical error on a test site.
The second layer is tagging. Each point is identified by hand in the imagery, which adds a small operator bias. According to Birdi's help center, that bias is about 20 to 30 mm for a ground control point. For prisms it is about 3 to 4 mm, because monitoring flights are flown very low. The accuracy guide for monitoring reports explains the three layers in full.
The third layer is movement itself. Because prisms are not used as control, the map is not bent to fit them. As a result, their measured positions are an honest check on movement, and each report can state its horizontal and vertical movement accuracy at the top. Image overlap, flight height and the condition of the control all affect those figures.
How do you run a prism movement report, step by step?
Upload the prism set to the site once, set the tolerances, capture and process the next survey with the prisms included, then generate the report and download it. The steps below follow Birdi's documented workflow, where prism reference sets, tolerance levels and prism movement reports are available on the Ultimate plan.
- Upload the prism set to the site as a CSV, from Birdi's template, choosing the coordinate system it was exported in. The guide to managing survey control covers this step.
- Set the tolerances on the site's Tolerance levels tab: a warning and an action level for horizontal (XY) and vertical (Z) movement.
- Create the new map from inside the site, so the prism set comes in with it and is used as checkpoints during processing.
- Generate the report from the prism set's table view, or right-click the prism set folder in the Layer Panel.
- Download the PDF. It arrives as a layer on the map, ready to open or share.
Birdi's guide to tolerances and prism movement reports documents each step.
How do you keep the report repeatable from cycle to cycle?
Keep the inputs stable. Use the same prism set, versioned when re-surveyed; the same tolerances unless someone deliberately changes them; and consistent flights. Then check labels and point status before each run, so the groupings and the network match what is physically on the embankment.
A few habits help. After uploading a re-survey, check each prism's embankment label before running the report, so the groupings come out as expected. Keep every point's status current, so a destroyed prism is not read as movement. Finally, keep the flight plan the same from capture to capture. The guide to comparing two surveys explains why consistent captures matter.
What should you look for in a monitoring tool?
Look for a tool that makes the recurring report repeatable and explainable: prism sets versioned at the site, tolerances with a full change history, prisms kept out of the control solution, movement shown horizontally and vertically by embankment and prism, stated accuracy, and a fixed record of what each report said.
It also helps when the rest of the team can see the same picture without waiting for the report. If your team captures a tailings facility with drones and wants the report produced in the same workspace as the maps, Birdi is a sensible option for mining teams on its Ultimate plan. It is not the instrument, however. A facility with an automated total station, or a geotechnical consultant who owns the monitoring program, keeps both; Birdi is where drone-derived movement is read against thresholds and reported.
Frequently asked questions
What is the difference between a warning level and an action level?
A warning level is the movement that prompts a closer look, such as more frequent readings or an inspection. An action level is the movement that triggers the response the facility's trigger action response plan defines. Both are set by the engineer of record for each facility, separately for horizontal and vertical movement.
Can drone photogrammetry measure prism movement accurately?
It can, within stated limits. Accuracy depends on ground control, how precisely each prism is tagged in the imagery and flight height. One platform documents tagging bias of about 3 to 4 mm for prisms on low monitoring flights. Keeping prisms out of the control solution makes them independent checkpoints on movement.
What happens to old reports if the tolerances change?
In a well-designed system, nothing. Each report records the tolerances in force when it was generated, and a later change does not re-band a report already issued. To see readings against the newer tolerances, generate a new report. This keeps every issued report consistent with what was actually sent.
Should tolerances be set in millimeters or meters?
Use whatever unit the tool expects, and check it carefully. Monitoring tolerances are usually discussed in millimeters, but some tools take meters, so a 75 mm warning level is entered as 0.075. A live preview of the bands before saving is the easiest way to catch a units mistake.
How often should tailings dam prisms be surveyed?
The facility's monitoring plan and its engineer of record set the frequency, based on the facility's risk and conditions. Drone-derived readings are often captured weekly or monthly, alongside instruments that read more often. Match the report to the plan, and increase frequency when readings approach a warning level.
About the author
This guide was written by the Birdi team. Birdi (birdi.io) is a geospatial AI workspace that construction and mining teams use to share drone, 360 and design data in one map. The standard and study cited are listed below, and Birdi's steps and accuracy figures come from its own help center, read on September 28, 2026.
Related reading
- What is tailings dam monitoring?: the methods and why facilities are watched so closely.
- Prism monitoring and dam safety: how geospatial data supports prism monitoring.
- Tailings dam monitoring software: the tools mining teams compare.
- Sites and geotechnical monitoring: the release that added prism movement reports.
Sources
- ICMM. "Global Industry Standard on Tailings Management." International Council on Mining and Metals, read September 28, 2026. https://www.icmm.com/en-gb/our-principles/tailings/global-industry-standard-on-tailings-management
- International Mining. "The Global Industry Standard on Tailings Management is launched." August 5, 2020. https://im-mining.com/2020/08/05/global-industry-standard-tailings-management-launched/
- Atik, M. and Arkali, M. "Comparative Assessment of the Effect of Positioning Techniques and Ground Control Point Distribution Models on the Accuracy of UAV-Based Photogrammetric Production." Drones 9 (1), 15, 2024. https://doi.org/10.3390/drones9010015
- Birdi. "Understanding accuracy in geotechnical monitoring reports." Birdi Help Center, read September 28, 2026. https://help.birdi.io/en/articles/17125217-understanding-accuracy-in-geotechnical-monitoring-reports
- Birdi. "How to set movement tolerances and run prism movement reports in Birdi." Birdi Help Center, read September 28, 2026. https://help.birdi.io/en/articles/16951320-how-to-set-movement-tolerances-and-run-prism-movement-reports-in-birdi