
How to improve collaboration between survey, engineering, and operations teams using shared site data

TL;DR: Survey, engineering, and operations teams collaborate best when they work from one live source of site data instead of exchanging static exports by email. This means publishing survey outputs (orthomosaics, DEMs, point clouds) to a shared platform where each team can view, comment, and measure directly, rather than converting and re-sending files at every handoff.
Key takeaways
- According to FMI and PlanGrid's "Construction Disconnected" report, poor project data and miscommunication account for 48% of all rework in US construction, at a cost of $31.3 billion a year.
- A 2004 NIST-commissioned study found inadequate data interoperability cost the US capital facilities industry $15.8 billion annually, with owners and operators absorbing $10.6 billion of that figure.
- The same FMI/PlanGrid research found that time spent fixing mistakes, searching for project data, and resolving conflicts costs the US construction industry $177.5 billion in labor annually.
- The most common root cause isn't a skills gap between teams — it's the lack of a common platform where survey, engineering, and operations can all access the same site data.
- Closing this gap doesn't require every team to learn GIS or CAD software; it requires a shared, accessible layer on top of the specialist tools each team already uses.
Why do survey, engineering, and operations teams struggle to collaborate on the same site data?
These three teams struggle to collaborate because they each work in different tools, at different points in a project's timeline, and rarely see the same version of the site at the same time. Survey data gets captured, processed, exported, and emailed — and by the time operations opens it, it may already be a version or two out of date.
Survey teams typically work in specialist software (photogrammetry tools, total station or GNSS software, CAD) to produce outputs like orthomosaics, digital elevation models (DEMs), point clouds, and topographic drawings. Engineering teams need those outputs to update design models and check as-built conditions against plans. Operations teams need a simplified view of the same information to make daily decisions about material, sequencing, or safety. Each group has a legitimate reason to want the data in a different format, but few organizations have a shared place where all three can access it live.
This creates a pattern that will be familiar to anyone who has worked across these teams: a surveyor captures a site, processes it, and exports a flattened PDF or image for engineering; engineering marks it up and emails it back with questions; operations, meanwhile, is working from an older printed version because nobody thought to loop them in. Each handoff introduces a delay and a chance for the wrong version to circulate.
What does poor data handoff between these teams actually cost?
Poor handoffs between survey, engineering, and operations are not just an inconvenience — they show up directly in rework, delay, and labor costs. According to FMI and PlanGrid's industry-wide "Construction Disconnected" study, miscommunication and inaccessible project data are responsible for 48% of all rework in the US construction industry, at an estimated cost of $31.3 billion a year.
That same research found that construction teams lose $177.5 billion annually in labor costs on non-optimal activities: fixing avoidable mistakes, hunting for the right version of a file, and resolving conflicts that a shared source of data would have prevented. The study identified the lack of a common platform for teams to communicate and share project data as one of the top three drivers of miscommunication — alongside unresponsiveness and poor cross-team collaboration habits.
The interoperability problem is not new, either. A 2004 study commissioned by the National Institute of Standards and Technology (NIST) put the annual cost of inadequate data interoperability in the US capital facilities industry at $15.8 billion, with owners and operators — the teams closest to day-to-day site decisions — bearing the largest share at $10.6 billion. Two decades on, the underlying issue the study identified (specialist teams producing data that downstream teams cannot easily use) is still the one most organizations are working to solve.
What does good collaboration between survey, engineering, and operations actually look like?
Good collaboration between these teams looks like a single, current version of the site that survey, engineering, and operations all view and mark up in the same place, instead of a chain of exported files moving between inboxes. The survey output stays the source of truth; every other team works from it directly rather than from a copy.
In practice, this means a few concrete things change. First, survey outputs are published somewhere every relevant team can open without needing the software that created them — an operations manager should not need a CAD or GIS license to view a site model. Second, feedback happens as comments and markups on the live map or model, so a question from engineering is visible to operations and survey at the same time, rather than buried in a separate email thread. Third, there is one clear version at any point in time, with a visible history of what changed and when, so nobody is working from last month's export by accident.
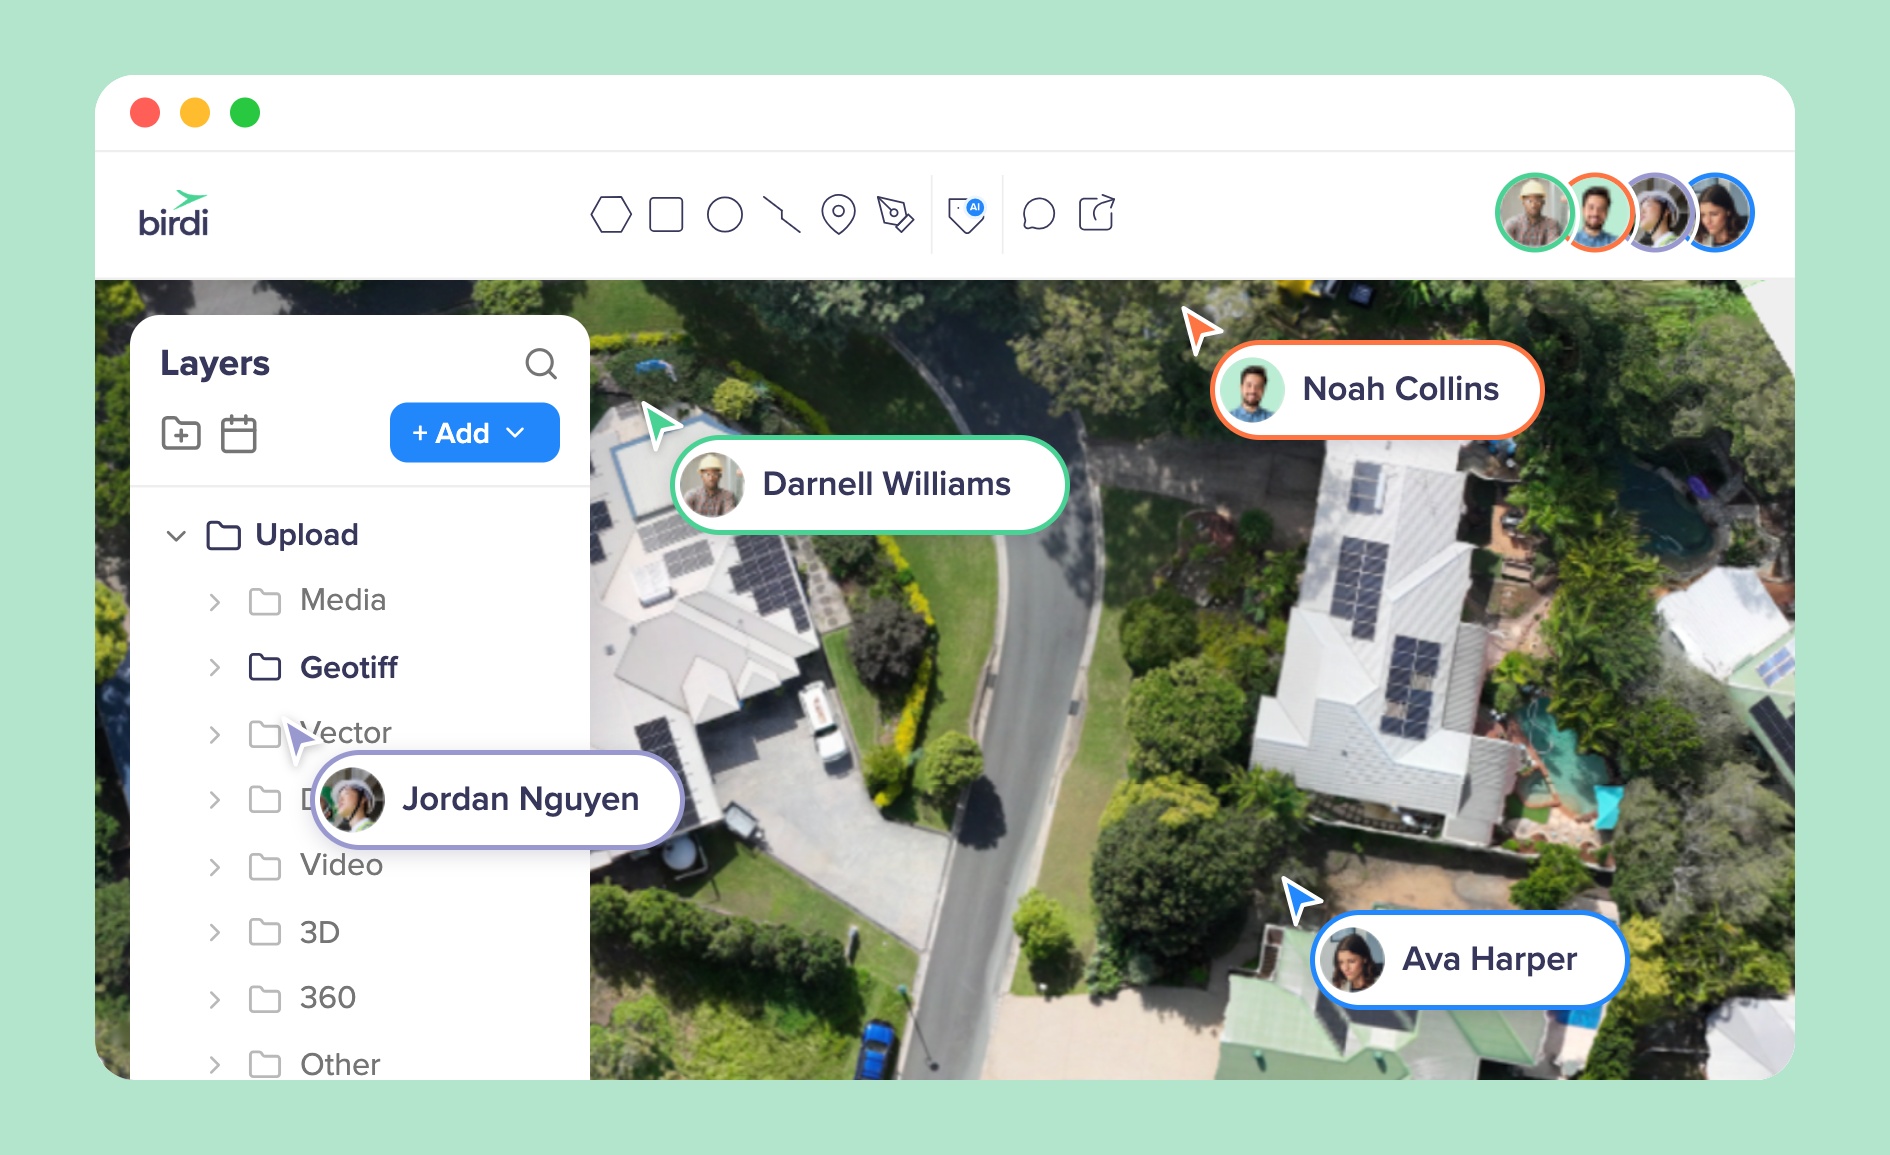
This is also where tools built specifically for cross-team collaboration on geospatial data — as opposed to general-purpose file storage — earn their place. A platform like Birdi is built around this exact handoff: survey teams upload and process the raw data, and engineering and operations view, comment, and measure directly on it without converting formats or needing GIS training. That said, it is not a substitute for the specialist processing tools surveyors already rely on — it sits alongside them as the layer everyone else uses to see and act on the output.
How can teams close the gap between survey capture and operational use of site data?
Teams close this gap by standardizing how site data is captured, published, and accessed, so operational and engineering staff can use it the moment it is ready rather than waiting for someone to convert and send it. A few practical steps make the biggest difference.
Agree on shared formats and coordinate systems up front. A survey team using a different coordinate reference system than engineering's design model guarantees a reconciliation step later. Sorting this out before capture, rather than after, removes one of the most common sources of rework.
Publish data once, to one place, in a format others can open directly. Rather than exporting a PDF for engineering and a printed map for operations, publish the processed orthomosaic, DEM, or model once to a shared platform where each team opens the same file with the view suited to their role.
Replace email round-trips with in-context comments. When engineering has a question about a specific point on the site, a comment pinned to that location on the shared map is faster to resolve and easier to track than an email describing where the issue is.
Set a clear update cadence and make it visible. Operations teams need to know whether they are looking at last week's survey or this morning's — a visible "last updated" date on shared site data avoids decisions being made on stale information, in the same way a drone services provider would timestamp a deliverable for a client.
What should you look for in a tool to connect survey, engineering, and operations teams?
Look for a platform that lets non-specialist teams view and act on survey outputs without needing the same software or training as the survey team, while still preserving the accuracy of the underlying data. The right tool sits between specialist capture tools and the wider business — not a replacement for either.
Practical things to check: does it accept the outputs your survey team already produces (orthomosaics, DEMs, point clouds, CAD or GIS layers) without heavy conversion work? Can engineering and operations comment, measure, and share views without buying a full GIS seat each? Is access controllable by role, so a contractor or client can see what they need without exposure to the rest of the project? And can data be shared externally, with a client or regulator, without asking them to install anything?
Birdi is one option worth considering for teams that need this kind of shared visibility layer across survey, engineering, and operations — particularly organizations in construction, mining, or utilities that already generate drone and survey data but struggle to get it in front of the people making daily decisions. It suits teams who want to keep their existing survey and processing tools and add a collaboration layer on top, rather than teams looking to replace a full GIS suite with deep spatial analysis capability — for that level of analysis, a dedicated GIS platform is still the better fit. You can see how the features work, or check pricing if cost is the deciding factor for your team.
Frequently asked questions
What is the difference between survey data and engineering data on a construction or infrastructure site?
Survey data is the raw or lightly processed record of existing site conditions — orthomosaics, point clouds, DEMs, or topographic drawings captured from the ground or by drone. Engineering data builds on that record to produce design models, as-built comparisons, and construction plans. Engineering can't be accurate without current survey data underneath it.
Why do operations teams often end up working from outdated site data?
Operations teams usually receive site data as a static export — a PDF, printed map, or spreadsheet — rather than a live view of the source. Once that export is created, it stops updating even as the survey or engineering data behind it changes, so operations can be working from a version that is weeks out of date without realizing it.
How can teams avoid re-surveying a site because previous data was lost or siloed?
The most reliable fix is storing survey outputs in a shared, permanent location that every team can access, rather than on an individual's laptop or in a project folder only the survey team can open. When data is centralized and access is role-based, previous surveys stay findable and usable long after the original project team has moved on.
What format should survey data be shared in for engineering and operations teams to use it?
There is no single format that suits everyone — engineering typically needs CAD- or GIS-compatible layers, while operations needs a simplified, browsable view like an interactive map or 3D model. The most effective approach is publishing the processed data once to a platform that can present it differently to each audience, rather than exporting a separate file type for every team.
Do operations teams need GIS software to use survey data?
No. Operations staff typically need to view, measure, and comment on site data, not perform spatial analysis, so a browser-based viewer is usually sufficient. Requiring operations teams to learn GIS or CAD software to access basic site information is one of the more common reasons collaboration between these teams breaks down.
Sources
- FMI Corporation & PlanGrid. "Construction Disconnected." 2018. https://pg.plangrid.com/rs/572-JSV-775/images/Construction_Disconnected.pdf
- Gallaher, M. P., et al. "Cost Analysis of Inadequate Interoperability in the U.S. Capital Facilities Industry." NIST GCR 04-867, National Institute of Standards and Technology, 2004. https://nvlpubs.nist.gov/nistpubs/gcr/2004/nist.gcr.04-867.pdf