
What is a digital elevation model (DEM)?

If you’ve spent any time working with drone mapping or geospatial data, you’ve probably come across the term “DEM.” It shows up in outputs, reports, and software dashboards, but what does it actually mean, and when would you use one?
Let’s break it down in a simple, practical way.
.png)
What is a digital elevation model (DEM)?
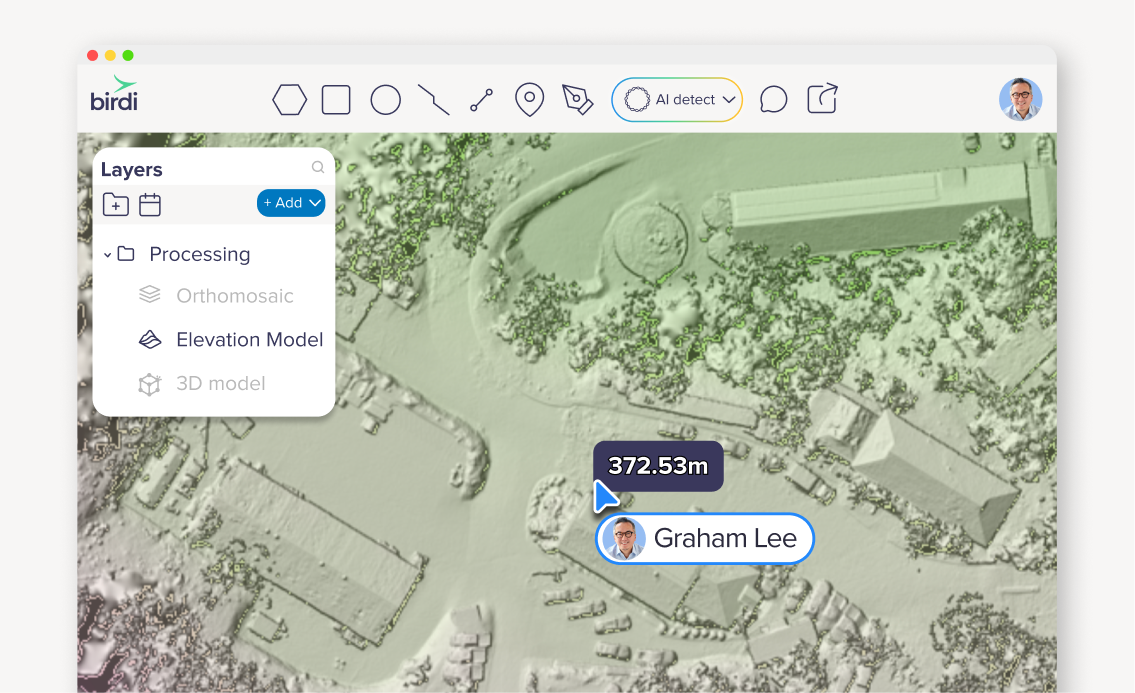
A digital elevation model (DEM) is a 3D representation of the Earth's surface that shows elevation values for every point in an area. It’s created from geospatial data, often captured by drones or satellites, and is used to analyze terrain, slopes, and surface features.
What does a DEM actually show?
At its core, a DEM is all about elevation. Instead of just seeing an image of a site (like an orthomosaic), you’re seeing how high or low every point is across the landscape.
That means you can start to answer questions like:
- Where are the high and low points on site?
- How steep is this slope?
- How does this area change over time?
- Where might water flow or pool?
You’re essentially turning a flat image into something you can measure and analyze in 3D.
How are DEMs created?
Most commonly, DEMs are created from aerial data — either from drones, aircraft, or satellites.
With drone mapping, the process usually looks like this:
- A drone captures hundreds (or thousands) of overlapping images
- Software processes those images using photogrammetry
- A 3D surface is reconstructed
- Elevation values are assigned to each point
From there, the DEM becomes one of the key outputs you can work with. You don’t really “see” a DEM as a photo. Iinstead, it’s visualized using color gradients, contours, or shading to represent elevation differences.
DEM vs DSM vs DTM: what’s the difference?
This is where things can get a bit confusing.
You might have seen a few different terms floating around:
- DEM (Digital Elevation Model) – general term for elevation data
- DSM (Digital Surface Model) – includes everything on the surface (trees, buildings, equipment)
- DTM (Digital Terrain Model) – represents the bare earth, with objects removed (e.g. the trees, buildings and equipment removed)
A simple way to think about it:
- DSM = what’s on the ground
- DTM = the ground itself
And DEM is often used as an umbrella term depending on the context.
When would you use a DEM?
This is where DEMs become really valuable. They’re not just “nice to have” – they’re often critical for understanding what’s happening on site.
Terrain analysis
.png)
Want to understand slopes, gradients, or elevation changes? A DEM gives you the data to do exactly that. This is especially useful in mining, construction, and infrastructure planning.
Volume calculations
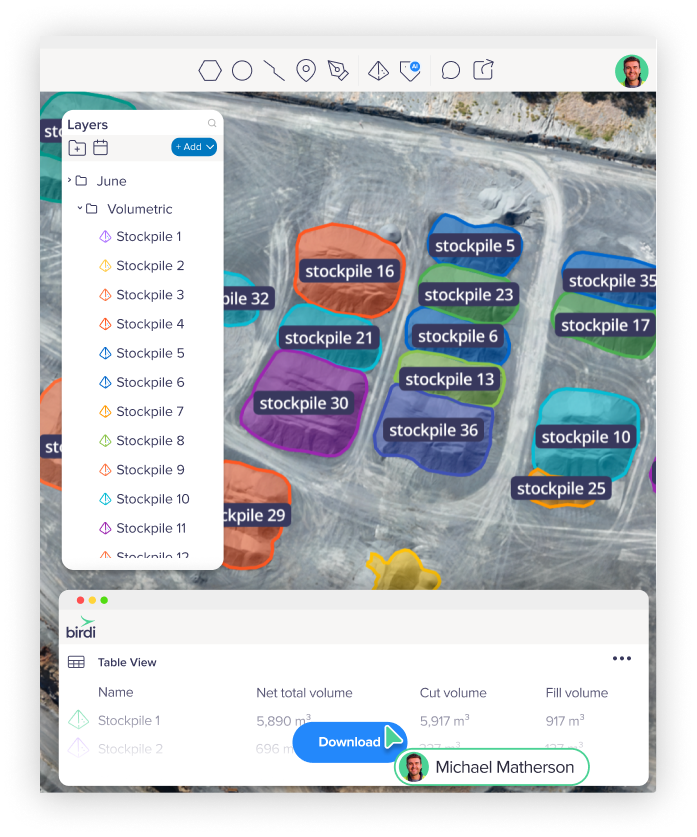
DEMs are commonly used to calculate volumes — like stockpiles or earthworks. By comparing elevation data over time, you can quickly see how much material has been added or removed.
Drainage and water flow
Ever wondered where water will go after heavy rain? DEMs help model flow paths, identify low points, and highlight potential problem areas.
Monitoring change over time
Because DEMs are based on measurable elevation data, they’re perfect for tracking change. You can compare two datasets and quickly identify:
- Erosion
- Land movement
- Site progression
How DEMs fit into your workflow
If you’re already working with drone data, DEMs are likely one of your core outputs, even if you’re not always thinking about them directly.
They typically sit alongside:
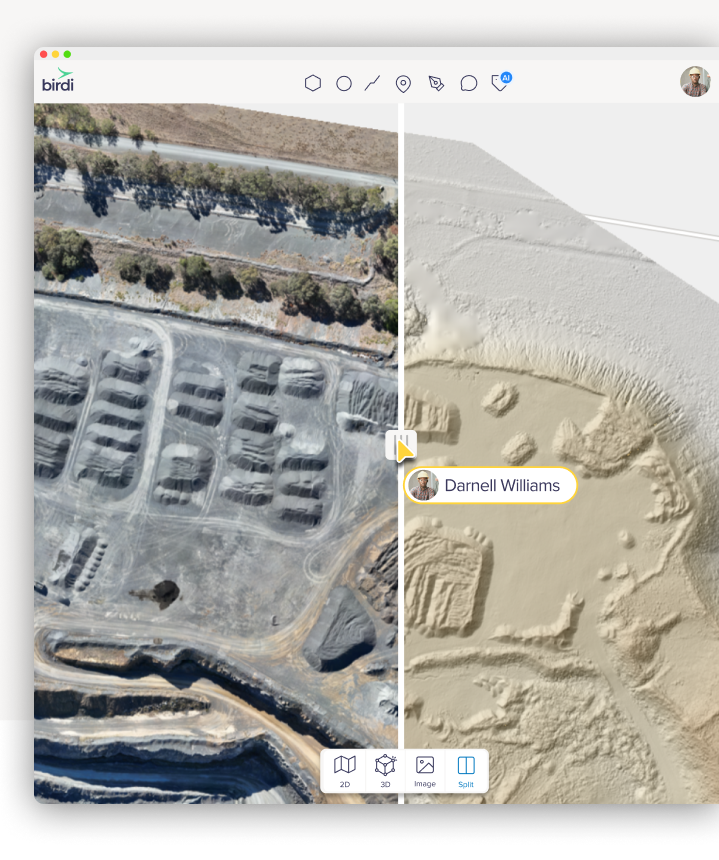
- Orthomosaics (for visual context)
- 3D models (for immersive viewing)
- Contours and profiles (for analysis)
The real value comes when you combine them. For example, you might use an orthomosaic to visually inspect a site, then switch to a DEM to understand elevation changes, and then use measurement tools to quantify what’s happening.
That’s where things start to move from “nice visuals” to actual decision-making.
___
A digital elevation model is one of the most important building blocks in geospatial workflows. It takes raw imagery and turns it into something measurable, something you can analyze, compare, and act on.
And once you start using DEMs regularly, you’ll probably find yourself asking fewer “what does this look like?” questions and more “what’s actually happening here?” ones.