
How to Compare Two Drone Surveys and See What's Changed

TL;DR: To compare two drone surveys, subtract one elevation surface from the other to make a difference grid, where every cell shows how far the ground rose or fell. The result is only trustworthy when both surveys use the same surface type, the same control and their real capture dates. In addition, any change smaller than their combined error is noise.
Key takeaways
- A difference grid shows change at every point, not only where someone thought to measure.
- Five well-spread ground control points gave 2.5 cm horizontal and 3.0 cm vertical error in one 2024 study, so small changes need good control on both surveys.
- Two errors add up. Two surfaces that are each accurate to about 3 cm can disagree by roughly 4 cm with nothing having moved.
- Vegetation causes false change. Compare bare-earth DTMs for ground movement, not DSMs, which include plants and machinery.
- Record the survey date, not the upload date, or you will measure the wrong period.
What is a difference grid?
A difference grid, also called a DEM of difference, is a raster made by subtracting one elevation surface from another, cell by cell. Each cell holds the change in height between the two surveys. Positive values mean the ground is higher than before, such as fill or a stockpile. Negative values mean it is lower, such as cut or settlement.
The idea is simple, but it answers a question a spot measurement cannot. For instance, a surveyor who checks ten points knows about ten points. A difference grid, however, shows every part of the site at once, so a slump near a wall or an unexpected pile stands out on the map.
Geomorphologists have used the method for years to measure erosion and deposition from repeat surveys. One widely cited paper describes how DEMs from repeat topographic surveys are differenced to build sediment budgets, and why their uncertainty has to be accounted for (Wheaton et al., 2010). Construction and mining teams use the same logic for earthworks, stockpiles and embankments.
What makes two drone surveys comparable?
Two surveys are comparable when they measure the same kind of surface, sit on the same control and coordinate system, and carry their real capture dates. If any of the three differs, the grid mixes real change with differences in method, and no color scheme can separate them afterwards.
The same surface type
A digital surface model (DSM) records the top of whatever the camera saw: trees, trucks, sheds and stockpiles. A digital terrain model (DTM), by contrast, estimates the bare ground underneath. So comparing a DSM from one month with a DTM from the next produces "change" wherever something stands on the ground. For ground movement, compare DTM with DTM. For anything that includes structures or material on the surface, compare DSM with DSM. The guide to DTM vs DSM covers when each one fits.
The same control and coordinate system
Both surveys need to be tied to the same ground control, in the same coordinate reference system. Otherwise a small shift between the two datasets appears as change everywhere. According to Atik and Arkali's 2024 study in Drones, a model with five evenly spread ground control points reached 2.5 cm horizontal and 3.0 cm vertical error. Meanwhile, the highest errors came from flights without ground control. As a result, consistent control on both surveys is one of the first things to get right. If coordinate systems are new to you, the guide to coordinate reference systems explains why they matter.
The real survey dates
A difference grid measures change between two moments, so those moments need to be the capture dates. Files are often uploaded days or weeks after the flight, however. If the upload date is used instead, the comparison describes the wrong period, and progress or settlement rates come out wrong.
How much change is real, and how much is noise?
A change is real only when it is larger than the combined error of the two surfaces. Because each survey carries its own error, the two add together when you subtract one from the other. Change below that threshold, which geomorphologists call the minimum level of detection, cannot be told apart from noise.
In practice, independent errors combine as the square root of the sum of their squares. So two surfaces that are each accurate to about 3 cm vertically can disagree by roughly 4.2 cm with nothing having moved. For example, a stockpile that "grew" by 3 cm between surveys has not measurably changed. A slope that dropped 15 cm, by contrast, clearly has.
Vegetation makes the noise worse. According to a 2026 study in Remote Sensing by van der Sluijs, Fraser and Lantz, which compared 273 terrain and canopy models from repeat drone surveys, terrain models were repeatable to about ±0.1 m in a vegetated site. That held only when imagery was 1.5 cm or finer and side-lap exceeded 80%. According to van der Sluijs and colleagues, coarser imagery also raised the underestimate of shrub heights from 4 to 9% to between 14 and 50%. The lesson for construction and mining is simple: expect false change in vegetated areas, and treat thin changes there with caution.
How do you read a difference grid?
Read a difference grid by its color ramp and its value range. Warm and cool colors usually separate gain from loss, and the range sets how much change fills the scale. Then check the unusual areas against the site: moving machinery, water and vegetation often show change that is not ground movement.
Start with the legend. A narrow value range makes small changes vivid, which suits settlement monitoring. A wide range, on the other hand, keeps large cuts and fills readable on an active earthworks site. Next, click into individual cells to read the change at a point, and compare it with what you know happened on site.
Finally, look for patterns rather than single cells. A consistent band of loss along a wall is worth investigating. A speckle of small values across a whole site, however, usually reflects the combined error rather than movement.
How do you create a difference grid, step by step?
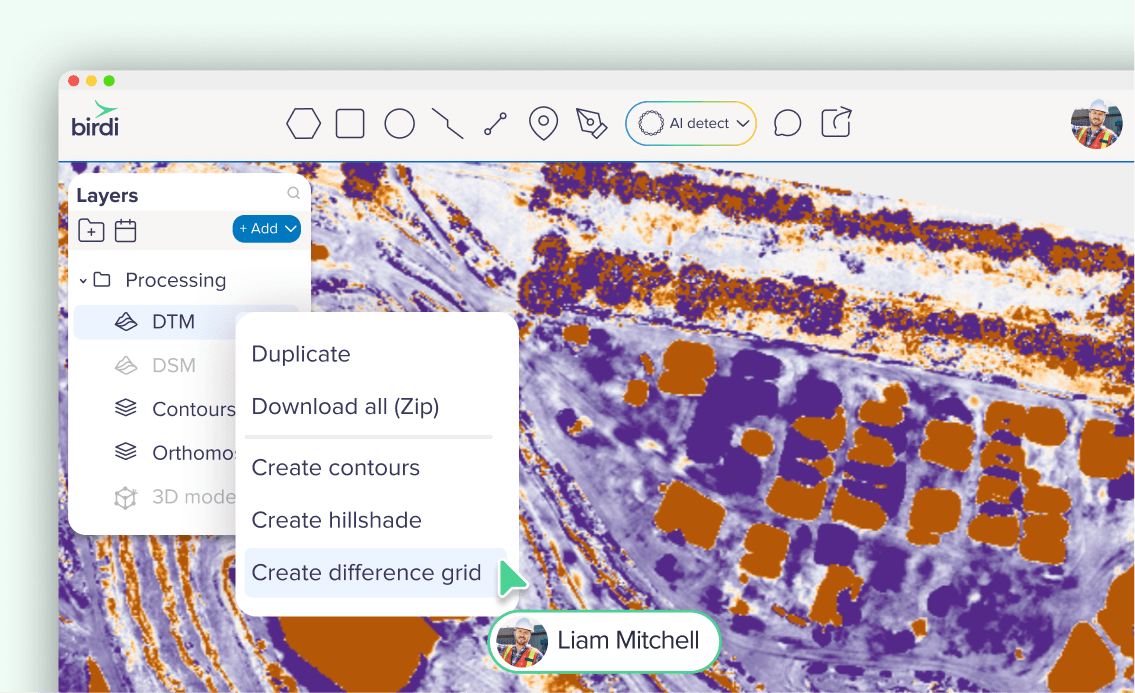
Creating a difference grid takes two surfaces of the same type, georeferenced to the same control, with their survey dates known. Pick the later survey as the one you subtract from, choose the earlier one to compare against, set a sensible value range, and generate the grid. Then read it against the noise threshold.
Most platforms that handle drone data follow a similar sequence. In Birdi (birdi.io), for example, the steps are:
- Right-click an elevation surface on a map and choose Create difference grid.
- Choose the second surface from anywhere in your workspace, not only the current map. Every surface in the picker shows its survey date.
- Set the color scheme and value range, and adjust the suggested name if you like.
- Create the grid, then click any pixel to read the change in meters.
- Restyle it later without regenerating it, or compare two difference grids to see how fast change is happening.
Birdi's help center documents these steps in its difference grid guide. Difference grids are available on Birdi's Growth and Ultimate plans. Birdi's AI agent, Scout, which is in beta, can also set up a split view or a difference grid when asked what changed between two surveys.
What are difference grids used for?
Difference grids are used wherever a team needs to know how the ground changed between captures. The common cases are earthworks progress on construction sites, material movement and stockpiles on mines and quarries, and settlement or slumping on embankments and walls, where small changes matter most.
On a construction site, a monthly grid shows where cut and fill happened since the last progress update. The owner can then see it without reading a spreadsheet. On a quarry, a weekly grid shows where material moved, which supports stockpile volume reconciliation. On an embankment, meanwhile, the combined error decides what the grid can and cannot show. That is why embankment monitoring usually pairs surfaces with fixed survey points, which the guide to prism movement reports covers.
What should you look for in a tool for comparing surveys?
Look for a tool that compares like with like and shows its working: surface types you can choose, survey dates rather than upload dates, comparison across all your surveys, a value range you control, and a way to read the change at any point. It should also keep earlier surveys organized by site.
Beyond the comparison itself, the surrounding workflow matters. For instance, it helps when every survey of a location sits in one place, so the earlier surface is easy to find. The guide to organizing surveys by site covers that side.
If your team needs to compare surveys without a GIS specialist running every request, Birdi is a sensible option for construction and mining teams who want the comparison in the same workspace as their maps. A surveyor who wants full control of processing, or an analyst who needs a desktop GIS for detailed volume and uncertainty analysis, may prefer to keep that work in specialist software.
Frequently asked questions
What is the difference between a DTM and a DSM for comparing surveys?
A DSM records the top of everything the camera saw, including vegetation, vehicles and buildings. A DTM estimates the bare ground underneath. To measure ground movement, such as settlement or cut and fill, compare two DTMs. To include structures and material on the surface, compare two DSMs. Never mix the two types.
Why does my difference grid show change where nothing moved?
Usually it is noise. Each survey has its own error, so two surfaces can disagree by a few centimeters with nothing having moved. Vegetation, water and moving machinery also show up as change. Check that both surfaces are the same type, on the same control, and treat small changes in those areas with caution.
How accurate is a difference between two drone surveys?
It is less accurate than either survey alone, because the two errors combine. As a rough guide, two surfaces each accurate to about 3 cm vertically can differ by about 4.2 cm through error alone. Good ground control on both surveys, fine image resolution and bare-earth surfaces all shrink that threshold.
Can I compare more than two surveys?
A difference grid compares two surfaces at a time. To see a trend, make grids for each pair of surveys and compare them. Some tools, including Birdi, let you compare two difference grids directly, which shows the rate of change over time rather than a single before and after.
How often should I compare surveys?
Match the comparison to how fast the site changes and what the result is for. Active earthworks and stockpiles are often compared weekly or monthly. Embankment and slope monitoring follows the monitoring plan's schedule. Comparing too often on a slow-moving site mostly shows noise, so let real change exceed the error first.
About the author
This guide was written by the Birdi team. Birdi (birdi.io) is a geospatial AI workspace that construction and mining teams use to share drone, 360 and design data in one map. The accuracy figures come from peer-reviewed studies listed below, and Birdi's steps come from its own help center, read on September 28, 2026.
Related reading
- DTM vs DSM: which elevation surface to compare for ground movement.
- What is a DEM?: the surface a difference grid is built from.
- How to reconcile stockpile volumes: turning measured change into a defensible number.
- Sites and geotechnical monitoring: the release that added difference grids.
Sources
- Wheaton, J. M., Brasington, J., Darby, S. E. and Sear, D. "Accounting for uncertainty in DEMs from repeat topographic surveys: improved sediment budgets." Earth Surface Processes and Landforms 35 (2), 2010. https://doi.org/10.1002/esp.1886
- Atik, M. and Arkali, M. "Comparative Assessment of the Effect of Positioning Techniques and Ground Control Point Distribution Models on the Accuracy of UAV-Based Photogrammetric Production." Drones 9 (1), 15, 2024. https://doi.org/10.3390/drones9010015
- van der Sluijs, J., Fraser, R. H. and Lantz, T. C. "Replicability of Digital Terrain Models and Canopy Height Models Derived from Drone Photogrammetry." Remote Sensing 18 (4), 627, 2026. https://doi.org/10.3390/rs18040627
- Birdi. "How to create a difference grid in Birdi." Birdi Help Center, read September 28, 2026. https://help.birdi.io/en/articles/16726906-how-to-create-a-difference-grid-in-birdi