
What is photogrammetry? How aerial images become maps and 3D models

TL;DR: Photogrammetry is the process of measuring real-world size, shape, and position from overlapping photographs. Software matches common points across images and uses camera geometry to triangulate their location in space. The output can be a flat, georeferenced map called an orthomosaic, a 3D point cloud, or a textured 3D model — photogrammetry is not exclusively a 3D technique.
Key takeaways
- Photogrammetry works by triangulating the position of matching points across overlapping photographs, not by scanning depth directly the way LiDAR does.
- According to NOAA's National Geodetic Survey, aerial photogrammetry has been used to produce flat nautical and aeronautical charts since 1919 — decades before 3D reconstruction was computationally possible.
- One of the most common photogrammetry outputs is the orthomosaic: a single, flat, georeferenced image stitched from many overlapping photos, not a 3D model at all.
- A 1997 NOAA survey of Cape Chiniak, Alaska, used 80% forward overlap and achieved an elevation accuracy of about 1.7 cm average error once tree cover was excluded from the check points.
- The American Society for Photogrammetry and Remote Sensing (ASPRS) ties accuracy standards for photogrammetric products to ground sample distance, overlap, and the number of ground control points used.
What is photogrammetry?
Photogrammetry is the science of making measurements from photographs — determining an object's real-world position, size, and shape by identifying the same point in two or more overlapping images. Software uses the camera's known geometry at each shot to triangulate that point's location in space, the same principle that lets a person judge distance using two eyes.
The term dates to well before drones or digital cameras existed. Analog photogrammetry using stereo pairs of aerial photographs and mechanical plotting instruments has been standard practice in mapping and charting agencies for over a century. What has changed is the input and the output: modern digital photogrammetry uses hundreds or thousands of overlapping images from a drone, aircraft, or satellite, and computer vision algorithms do the triangulation automatically instead of a human operator using a stereoscope.
According to NOAA's National Geodetic Survey, the U.S. Coast and Geodetic Survey — a NOAA predecessor agency — first used photographs taken from an aircraft to revise nautical and aeronautical charts in 1919. By the late 1930s, metric aerial photographs had become the primary source material for coastal survey maps, replacing slower and more expensive ground-based plane table surveys. That history matters because it shows photogrammetry's original and, for decades, only output was a flat map — not a 3D model.
How do aerial images become maps and 3D models?
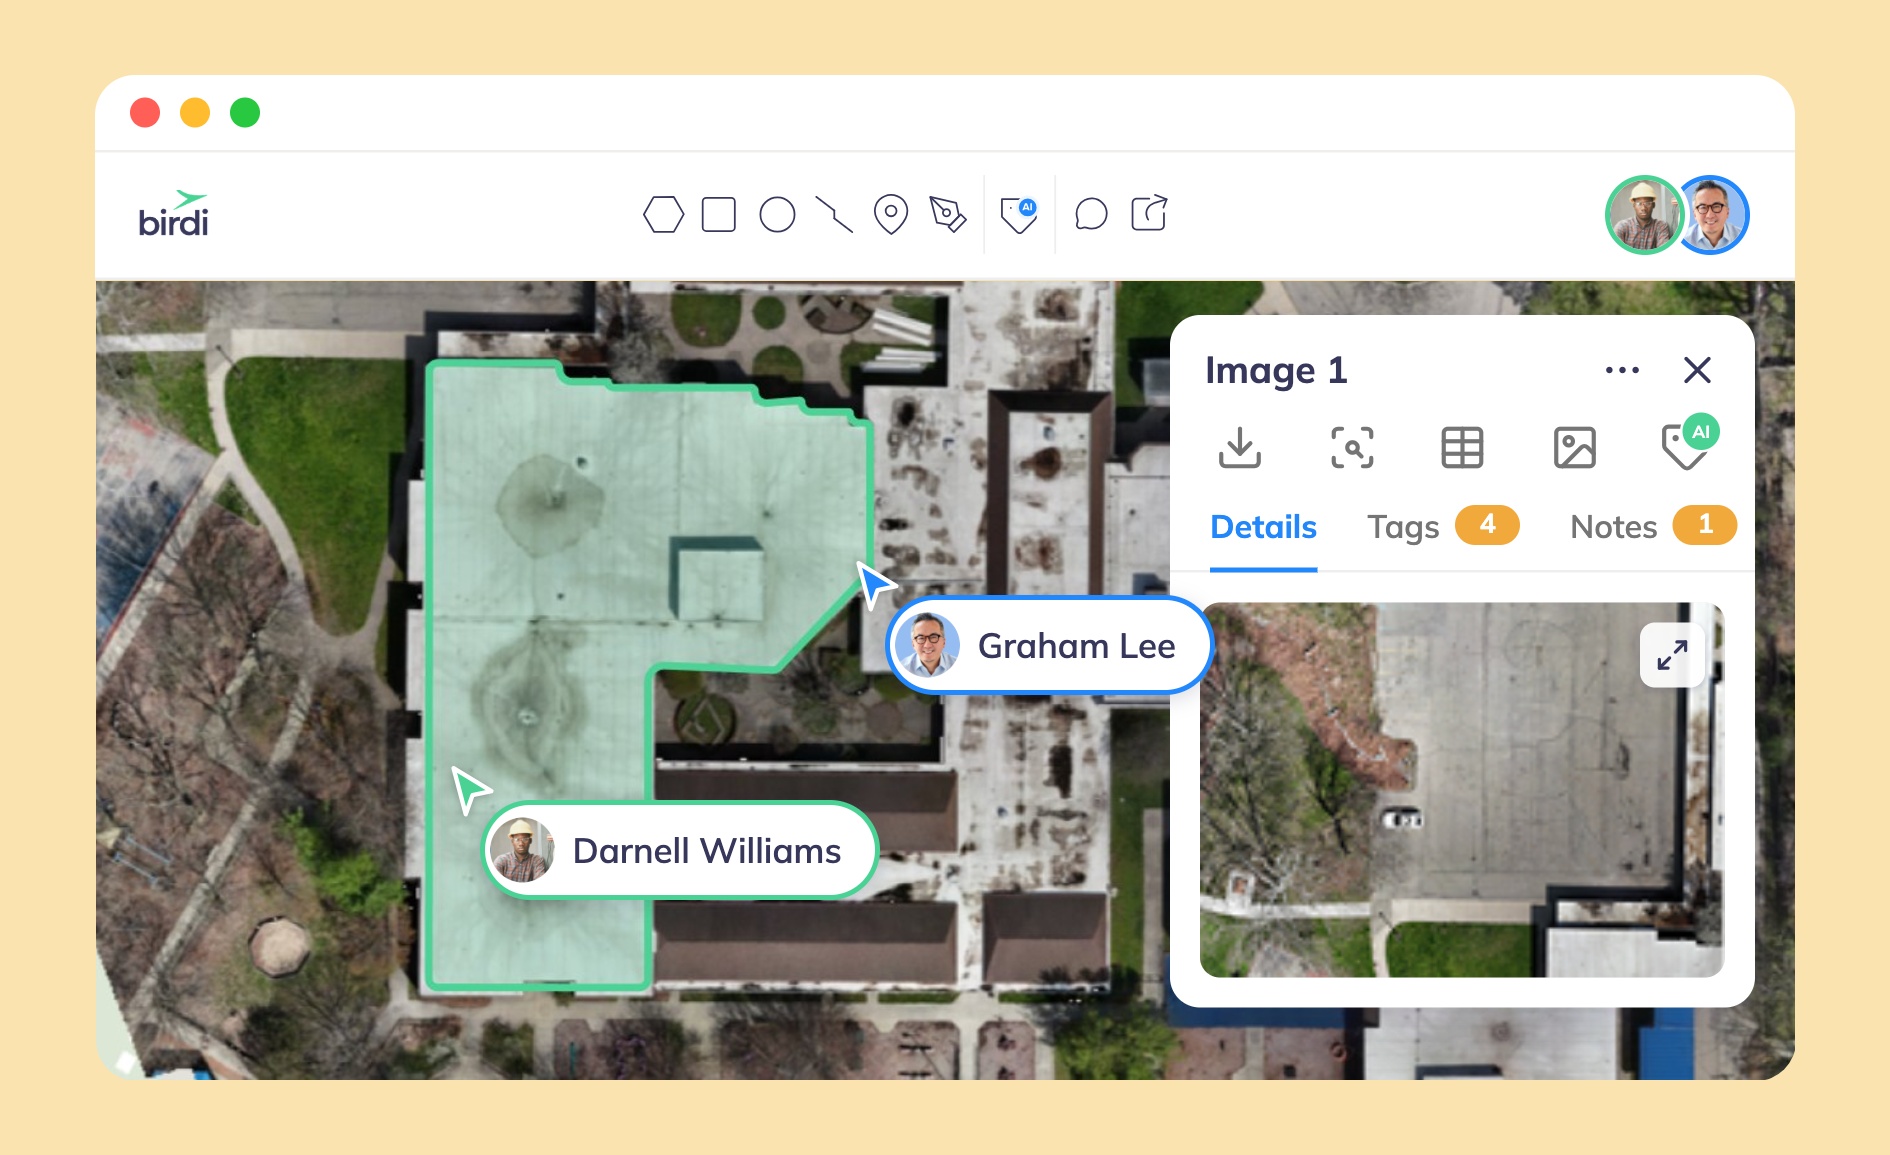
A drone or aircraft flies a grid over a site, capturing hundreds of overlapping photos, and software matches common features across those images to reconstruct the camera's flight positions and the shape of the ground below. That same dataset can then become a flat orthomosaic map, a 3D point cloud, or a textured mesh, depending on the project's needs.
The processing pipeline generally runs in stages. First, the software detects distinctive features — corners, edges, texture patterns — and matches them across overlapping photos. That produces a sparse point cloud and, at the same time, calculates where the camera was positioned for every photo, a technique known as Structure from Motion (SfM). The U.S. Geological Survey describes SfM as a method that "automatically estimat[es] internal camera geometry, position, and orientation based on image data alone," which is what allows old photographs without any recorded flight path to still be processed accurately.
From the sparse point cloud, the software densifies the reconstruction into a full 3D point cloud using multi-view stereo matching. That point cloud can be left as-is for volume and distance measurements, turned into a textured 3D mesh for visualization, or flattened into a digital elevation model. A separate but related step — orthorectification — corrects the original photos for camera tilt and terrain distortion and stitches them into a single flat, geographically accurate image: the orthomosaic. Whether a project needs the 3D outputs, the flat orthomosaic, or both depends entirely on the task, not on some limitation of the method.
Does photogrammetry always produce a 3D model?
No. Photogrammetry produces 3D outputs — point clouds, meshes, elevation models — but one of its most common deliverables is a purely 2D product: the orthomosaic, a flat, georeferenced map with no height information beyond what informed the correction. Treating photogrammetry as a "3D technique" undersells how much of its real-world use is flat mapping.
This is easiest to see historically. The NOAA aerial charting programs described above ran for decades using stereo photo pairs and mechanical plotters to produce flat nautical and topographic charts. No one was building 3D models; the entire point was an accurate 2D map. The U.S. Geological Survey's Structure from Motion work on historical aerial photography follows the same pattern in a modern context: researchers at Lassen Volcanic National Park processed roughly 1,250 scanned aerial photographs spanning 1941 to 2004, using around 300 ground control points across a 430-square-kilometer area, specifically to generate high-accuracy orthomosaics for tracking vegetation change over time — a flat-map output, even though the underlying SfM process also produced a 3D point cloud along the way.
In current drone-based work, orthomosaics remain the default deliverable for construction progress tracking, land surveys, and agricultural monitoring, because a flat, to-scale map is what most stakeholders actually need to measure area, mark up locations, or compare against a plan. Point clouds, meshes, and digital elevation models get pulled from the same flight data when a project specifically needs volumes, terrain analysis, or a walkable 3D visualization. The 3D products get more attention because they look impressive, but the flat map is usually the workhorse.
How accurate is photogrammetry?
Photogrammetric accuracy depends on three factors working together: ground sample distance (the real-world size of one pixel), the percentage of overlap between photos, and how many surveyed ground control points are used to anchor the model. Under good conditions with proper ground control, photogrammetry can reach centimeter-level accuracy; without it, accuracy is roughly proportional to the ground sample distance.
A concrete, documented example: NOAA's National Geodetic Survey generated a digital surface model of Cape Chiniak, Alaska, from aerial photographs taken at 3,000 feet with 80% forward overlap, scanned at a resolution yielding a 7 cm ground sample distance. Preliminary accuracy analysis found an average elevation error of 29 cm across all check points, dropping to a remarkable 1.7 cm average error once 21 check points located on trees were excluded — tree canopy, not the photogrammetric method itself, drove most of the error. NOAA reported the resulting model as accurate to about 60 cm at the one-sigma level for the full dataset, including vegetated points.
The American Society for Photogrammetry and Remote Sensing (ASPRS) formalizes this relationship in its Positional Accuracy Standards for Digital Geospatial Data, which tie horizontal and vertical accuracy classes to ground sample distance and the density of ground control used, and specify the checkpoint counts needed to validate a given accuracy claim. In practice, this means two photogrammetry projects flown with the same camera can have very different accuracy depending on flight altitude, overlap settings, and how much ground control was surveyed in — accuracy is a function of methodology, not a fixed property of the technology.
How is photogrammetry different from LiDAR?
Photogrammetry builds its measurements from overlapping photographs and camera geometry; LiDAR measures distance directly by timing laser pulses bounced off surfaces. The difference shows up most in vegetation and lighting: LiDAR pulses pass through gaps in tree canopy to reach the ground beneath, while photogrammetry can only reconstruct what its cameras actually see, and needs consistent light to do it well.
That makes photogrammetry a strong fit for open, well-lit sites — quarries, construction pads, agricultural land, cleared civil sites — where its color-accurate, photorealistic output is often more useful than LiDAR's point data alone. LiDAR tends to be the better choice on vegetated, forested, or complex terrain, and in situations that demand high accuracy without dense ground control. Many survey teams use both: LiDAR for the bare-ground surface, photogrammetry for the visual texture layer on top. Neither displaces conventional ground survey entirely; both are inputs a licensed surveyor still checks against control.
How do you choose the right approach for your project?
Start from the deliverable you actually need, not the technology that sounds more advanced. If the goal is a to-scale flat map for marking up progress, measuring areas, or sharing context with people who aren't geospatial specialists, an orthomosaic from drone photogrammetry is usually sufficient and considerably cheaper than a LiDAR survey. If the goal is precise terrain modeling under vegetation, sub-5 cm accuracy without extensive ground control, or mapping a pit floor in shadow, LiDAR is the better tool.
Once the data exists, the harder problem is often getting it in front of the people who need it — site managers, clients, or executives who were never going to open desktop GIS software. This is where a platform like Birdi fits in: it lets teams upload orthomosaics, point clouds, and 3D models generated by photogrammetry software and share them on a collaborative map, with comments and view-only links, without requiring the recipient to have any GIS training. Birdi also offers pay-as-you-go drone data processing for teams that want raw imagery turned into these outputs without owning a photogrammetry license. It suits teams that need to visualize, share, and collaborate around photogrammetric outputs quickly; an organization that needs deep photogrammetric processing control — custom camera calibration, specialized correction workflows, dense forestry classification — is better served by a dedicated processing package such as Pix4D or Agisoft, feeding its outputs into a platform like Birdi for distribution.
Frequently asked questions
What is photogrammetry in simple terms?
Photogrammetry is the process of measuring real-world objects and terrain from photographs. By matching the same points across multiple overlapping images and using the camera's known position for each shot, software works out the true size, shape, and location of what's in the photos — no direct physical measurement required.
Does photogrammetry only make 3D models?
No. Photogrammetry produces 2D orthomosaics — flat, georeferenced maps — just as often as 3D point clouds, meshes, or elevation models. For most construction, land, and agricultural surveys, the flat orthomosaic is the primary deliverable; the 3D outputs come from the same processing pipeline when a project specifically needs them.
What equipment do you need for photogrammetry?
At minimum, a camera capable of capturing overlapping photos and photogrammetry software to process them. Drones have become the standard capture platform for site-scale work because they can fly a consistent grid pattern with high overlap, but satellites, aircraft, and even handheld or ground-based cameras are also used depending on the scale of what's being measured.
How is photogrammetry different from a 3D scanner?
A 3D scanner, such as a LiDAR unit, measures distance directly using laser pulses and produces a point cloud without needing overlapping images. Photogrammetry infers 3D position indirectly, by triangulating matching points across ordinary photographs. Photogrammetry is generally cheaper and captures true color and texture; direct scanning is generally more accurate in vegetated or low-light conditions.
Is drone photogrammetry accurate enough for construction surveys?
Yes, when flown with adequate overlap and ground control. Accuracy depends on ground sample distance, overlap percentage, and the number of surveyed ground control points used, as formalized in ASPRS's positional accuracy standards; well-controlled drone photogrammetry has been documented achieving elevation errors in the low single-digit centimeters on open, unobstructed ground.
Sources
- NOAA National Geodetic Survey. "Photogrammetry." National Oceanic and Atmospheric Administration. https://www.ngs.noaa.gov/RESEARCH/RSD/main/photo/photo.shtml
- U.S. Geological Survey, EROS Center. "Structure from Motion (SfM) Photogrammetric Processing of Historical Aerial Photographs." USGS Land Imaging Report, 2021. https://eros.usgs.gov/doi-remote-sensing-activities/2021/usgs/structure-motion-sfm-photogrammetric-processing-historical-aerial-photographs
- American Society for Photogrammetry and Remote Sensing. "Positional Accuracy Standards for Digital Geospatial Data." ASPRS. https://asprs.org/Main/Main/Standards/Positional-Accuracy-Standards.aspx
- NOAA Office for Coastal Management. "Historical Aerial Imagery." NOAA Digital Coast. https://coast.noaa.gov/digitalcoast/data/aerialphoto.html