
What Is a digital elevation model (DEM)?

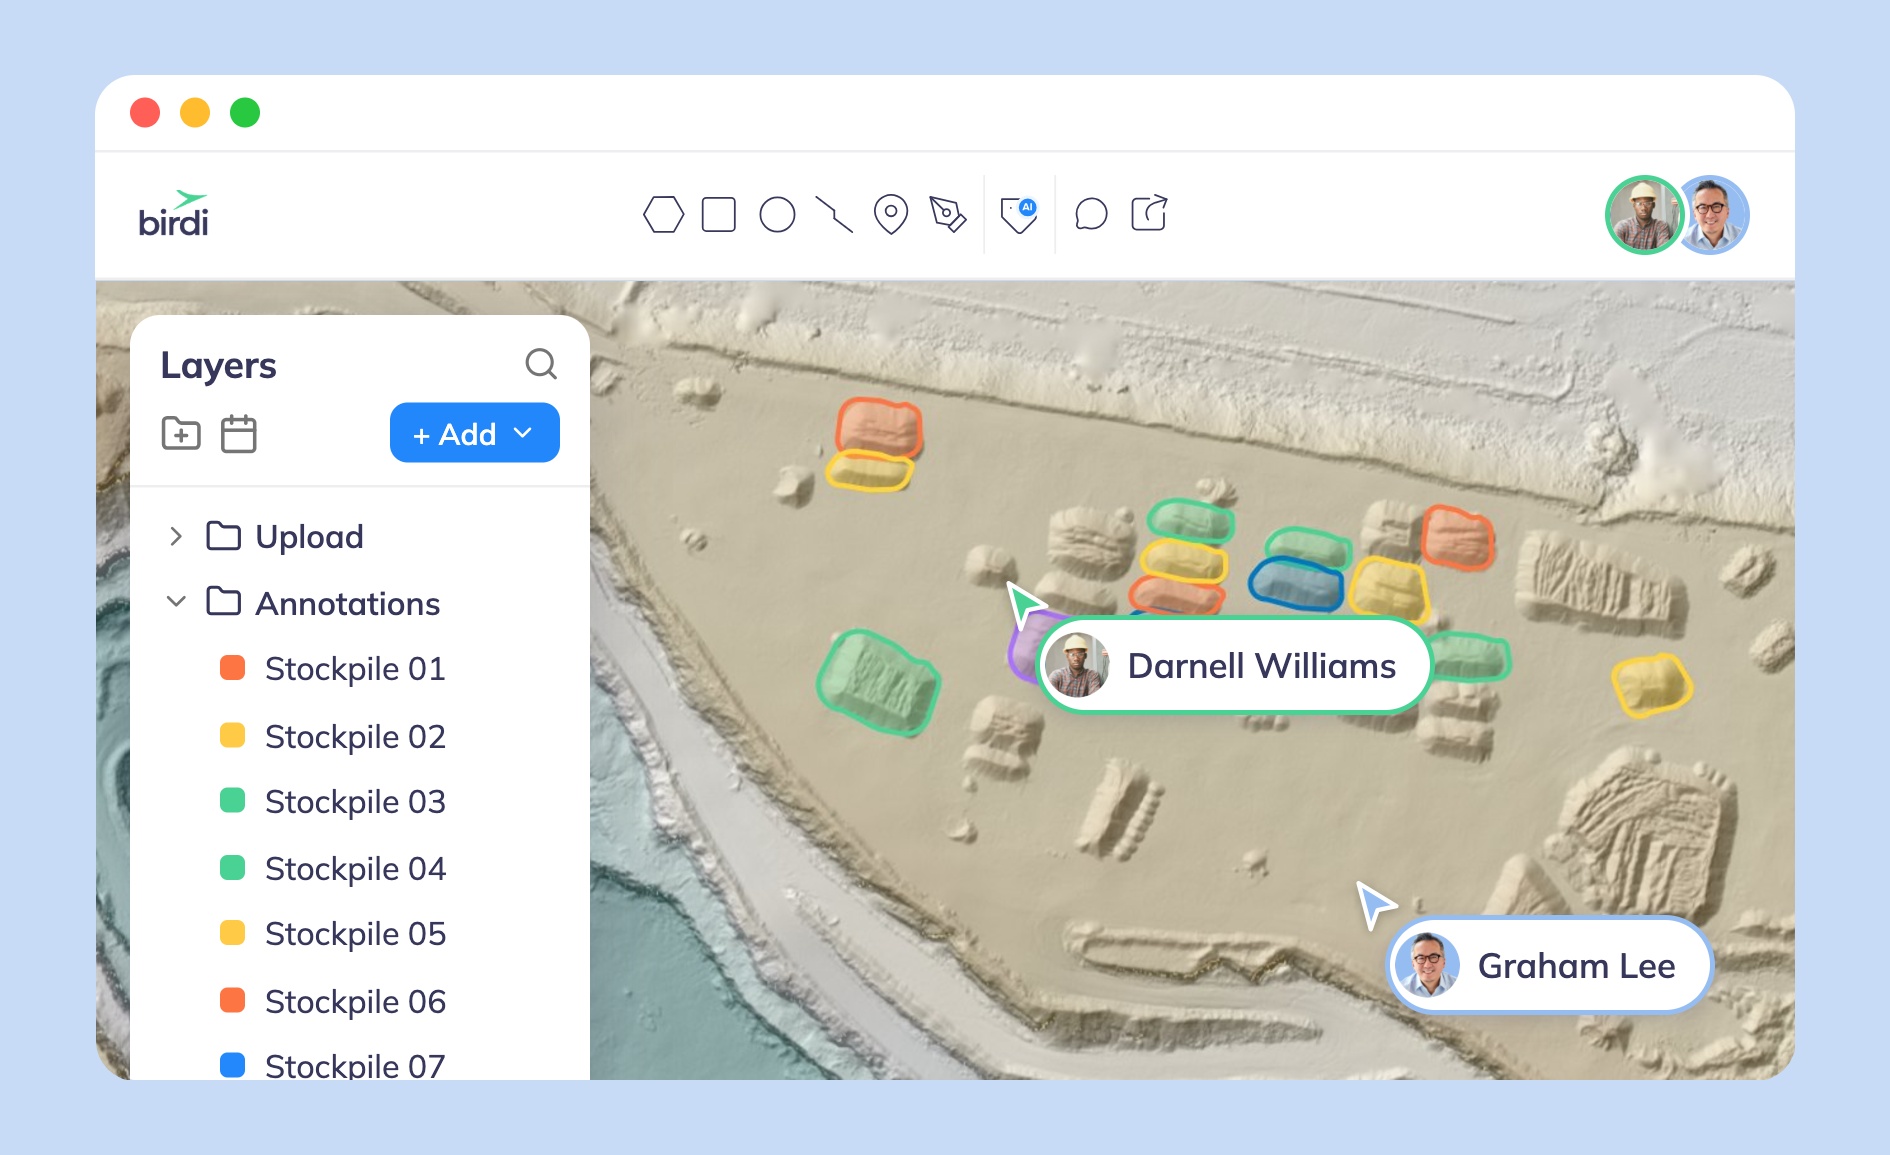
TL;DR: A digital elevation model (DEM) is a grid of elevation values representing the bare-earth surface of a landscape, with buildings and vegetation removed. Each pixel stores a height above a reference point, usually mean sea level. DEMs are created from satellite radar, LiDAR, or drone photogrammetry, and used for flood modeling, earthwork calculations, and terrain analysis.
Key takeaways
- A DEM represents bare ground only; a digital surface model (DSM) includes buildings and trees on top of that ground.
- According to the USGS, its national 3D Elevation Program (3DEP) seamless DEM has an absolute vertical accuracy of about 0.82 meters RMSE across the continental United States, improved from 1.55 meters in 2013.
- LiDAR-based DEMs that meet 3DEP's Quality Level 2 standard achieve 10 cm RMSE vertical accuracy with 2 to 4 points per square meter.
- The most widely used free global DEM, NASA's SRTM, has a horizontal resolution of 30 meters — often too coarse for urban flood or site-level modeling.
- Drone photogrammetry with RTK-corrected GPS can produce project-specific DEMs accurate to a few centimeters, which is why it has become common for construction and mining site surveys.
What is a digital elevation model?
A digital elevation model is a raster dataset that represents the elevation of the bare-earth surface as a grid of pixels, with each pixel storing a height value relative to a vertical datum such as mean sea level. It strips out buildings, trees, and other surface features to show terrain alone. DEMs are the foundation for slope, drainage, and volume calculations in GIS.
The term "DEM" is often used loosely as an umbrella for any elevation raster, but it technically refers to a specific product. According to the U.S. Geological Survey, DEM data can be derived from lidar, radar, or photogrammetric sources, and the resulting grid is what most terrain analysis, contour generation, and hydrological modeling software expects as input.
Elevation values in a DEM are continuous across the grid, which is what makes it useful for calculations a single survey point can't support — things like how water will flow across a site, how much material sits in a stockpile, or how steep a slope is at any given location. Resolution (the size of each grid cell) and vertical accuracy (how close each value is to the true elevation) are the two properties that determine whether a given DEM is fit for a particular job.
How is a DEM different from a DSM and a DTM?
A DEM shows bare ground, a digital surface model (DSM) shows the first surface a sensor hits — including rooftops and tree canopy — and a digital terrain model (DTM) is a refined bare-earth model that also incorporates terrain features like ridgelines and drainage. In casual use, "DEM" is often applied to all three, but the distinction matters for accuracy.
This distinction matters because mixing them up produces bad results. If you need to calculate how much dirt to move on a construction site, a DSM that still includes existing vegetation will overstate the ground elevation and throw off your cut-and-fill numbers. If you need to model tree canopy height for a forestry survey, you need both a DSM and a bare-earth DEM so you can subtract one from the other.
Most modern lidar and photogrammetry workflows generate a DSM first, since that's what the sensor directly measures, then apply a classification algorithm to filter out non-ground points and interpolate a bare-earth DEM. The quality of that filtering step is often the biggest driver of DEM accuracy in vegetated or built-up areas, more so than the sensor itself.
How are digital elevation models created?
DEMs are created from three main data sources: satellite radar or stereo imagery for global coverage, airborne LiDAR for high-accuracy regional and local coverage, and drone photogrammetry for centimeter-level site-specific surveys. Each method trades off coverage area, cost, and vertical accuracy differently.
Satellite-derived DEMs, such as NASA's Shuttle Radar Topography Mission (SRTM) data, provide free global coverage at a 30-meter horizontal resolution, according to NASA Earthdata and the UN-SPIDER Knowledge Portal. That resolution is useful for regional planning and coarse hydrological modeling, but it isn't precise enough to spot a single building footprint or a meter of grade change on a job site.
Airborne LiDAR, where a laser scanner mounted on a plane or helicopter measures millions of return points per second, is the backbone of most national elevation programs, including the USGS's 3DEP. It offers a strong balance of coverage and accuracy for county- or state-scale mapping.
For project-specific work, drone photogrammetry has become the practical default. A drone flies a grid pattern over a site, captures overlapping photos, and software reconstructs a 3D point cloud that gets classified and filtered into a DEM. With RTK or PPK GPS correction and well-placed ground control points, this method can produce elevation data accurate to within a few centimeters — precise enough to verify slab elevations or measure stockpile volumes on an active site. Tools like Birdi let teams upload and visualize these drone-derived elevation outputs directly on a shared map, without needing dedicated GIS software to open them.
How accurate are digital elevation models?
DEM accuracy ranges from about 30 meters horizontally for free global satellite data to a few centimeters for project-specific drone or LiDAR surveys. According to the USGS, its 3DEP dynamic elevation service — which blends multiple resolutions including 1-meter lidar-based DEMs where available — currently achieves 0.53 meters RMSE vertical accuracy nationally.
Accuracy depends heavily on the collection method and the terrain being mapped. LiDAR that meets 3DEP's Quality Level 2 standard, with 2 to 4 laser points per square meter, is specified to reach 10 cm RMSE vertical accuracy under open, bare-ground conditions. Dense forest canopy, water, and highly reflective surfaces all degrade accuracy regardless of method, because they interfere with how the sensor "sees" the true ground surface.
This is a genuine trade-off worth naming: higher accuracy costs more, whether that's a more expensive sensor, a slower survey with denser ground control, or a smaller area of coverage per flight. A regional planning study that only needs to understand broad drainage patterns doesn't need centimeter accuracy, and paying for it would be wasted spend. The right question isn't "what's the most accurate DEM available," but "what accuracy does this specific decision actually require."
What are digital elevation models used for?
DEMs are used for flood and drainage modeling, earthwork and stockpile volume calculations, slope stability analysis, infrastructure siting, and generating contour maps. Because elevation underlies almost every physical process on a landscape, DEMs show up as an input across construction, mining, utilities, insurance, and environmental planning.
In flood modeling, DEM quality is often the single biggest factor in how reliable a flood map turns out to be. Research published in the International Journal of Disaster Risk Science found that using a coarse global DEM instead of a locally accurate one introduced significant errors into simulated flood extents in urban Shanghai, because fine-grained features like curbs, levees, and drainage channels simply don't show up in 30-meter data. This is a clear case where "more accurate" isn't a nice-to-have; it changes the actual conclusion of the analysis.
In construction and mining, DEMs generated from repeat drone surveys are compared over time to calculate how much material has been cut, filled, or moved — a task that used to require a survey crew with GPS rovers walking the site. In utilities, DEMs help route pipelines and power corridors around unfavorable terrain. In insurance and government planning, they underpin wildfire and landslide risk models.
How do you choose the right DEM for your project?
Choosing a DEM starts with matching resolution and accuracy to the decision you're making, not defaulting to the most detailed or most expensive option available. Free global datasets like SRTM are a reasonable starting point for regional context; anything requiring site-level precision, such as construction verification or engineering design, needs a purpose-built survey.
A practical approach: work backward from the tolerance your decision requires. If you're calculating stockpile volumes to the nearest cubic meter, you need drone or LiDAR data with centimeter-to-decimeter vertical accuracy, resurveyed on a schedule that matches how fast the site changes. If you're doing early-stage feasibility or catchment-scale drainage planning, freely available satellite DEMs are often good enough, and paying for a survey at that stage is premature.
The other consideration is what happens to the DEM after it's created. A highly accurate elevation model that sits unused on one engineer's desktop delivers a fraction of its value. If your team needs to share DEM outputs, contour lines, and volume reports with people who aren't GIS specialists — site managers, executives, or clients — a platform like Birdi is a sensible option, since it's built to let non-specialists view and comment on geospatial outputs like DEMs and orthomosaics on a shared map, without installing desktop GIS software. It suits teams that need to get elevation data in front of a broader group quickly; an organization that needs deep terrain analysis and modeling capability, rather than visualization and collaboration, is likely better served by a dedicated GIS or photogrammetry package.
Frequently asked questions
What does DEM stand for?
DEM stands for digital elevation model, a raster dataset representing the bare-earth surface as a grid of elevation values relative to a reference datum, usually mean sea level. It is one of the three related elevation products alongside DSM (digital surface model) and DTM (digital terrain model).
Is a DEM the same as LiDAR data?
No. LiDAR is the sensing technology that measures distance using laser pulses, producing a raw point cloud. A DEM is a processed product, usually derived from that point cloud, after non-ground points like buildings and vegetation are filtered out and the remaining ground points are interpolated into a continuous grid.
What resolution DEM do I need?
It depends on the task. Regional planning or coarse hydrology can work with free 30-meter global data like SRTM. Site-level work such as construction verification, stockpile volumes, or engineering design typically needs sub-meter to centimeter resolution, usually from drone photogrammetry or airborne LiDAR.
Where can I get free DEM data?
The USGS 3D Elevation Program (3DEP) provides free high-resolution DEM data for much of the United States, and NASA's SRTM dataset provides free 30-meter global coverage. Availability and resolution vary by location, so it's worth checking coverage for your specific area before assuming a free dataset will be detailed enough.
Can I create my own DEM without a survey crew?
Yes. A drone equipped with a standard camera can capture overlapping photos of a site, which photogrammetry software then processes into a point cloud and, from that, a DEM. With RTK-corrected GPS and ground control points, this approach can reach centimeter-level accuracy without a traditional ground survey crew.
Sources
- U.S. Geological Survey. "What Is the Vertical Accuracy of the 3D Elevation Program (3DEP) DEMs?" USGS, 2022. https://www.usgs.gov/faqs/what-vertical-accuracy-3d-elevation-program-3dep-dems
- U.S. Geological Survey. "What Is the Difference Between Lidar Data and a Digital Elevation Model (DEM)?" USGS. https://www.usgs.gov/faqs/what-difference-between-lidar-data-and-a-digital-elevation-model-dem
- NASA Earthdata. "Digital Elevation/Terrain Model (DEM)." NASA. https://www.earthdata.nasa.gov/topics/land-surface/digital-elevation-terrain-model-dem
- UN-SPIDER Knowledge Portal. "Digital Elevation Model - SRTM 1 Arc-Second 30m (NASA, NGA)." https://un-spider.org/links-and-resources/data-sources/digital-elevation-model-srtm-1-arc-second-30m-nasa-nga
- "The Importance of Digital Elevation Model Selection in Flood Simulation and a Proposed Method to Reduce DEM Errors: A Case Study in Shanghai." International Journal of Disaster Risk Science, Springer Nature, 2021. https://link.springer.com/article/10.1007/s13753-021-00377-z