
What is a 3D mesh and how is it used in construction?

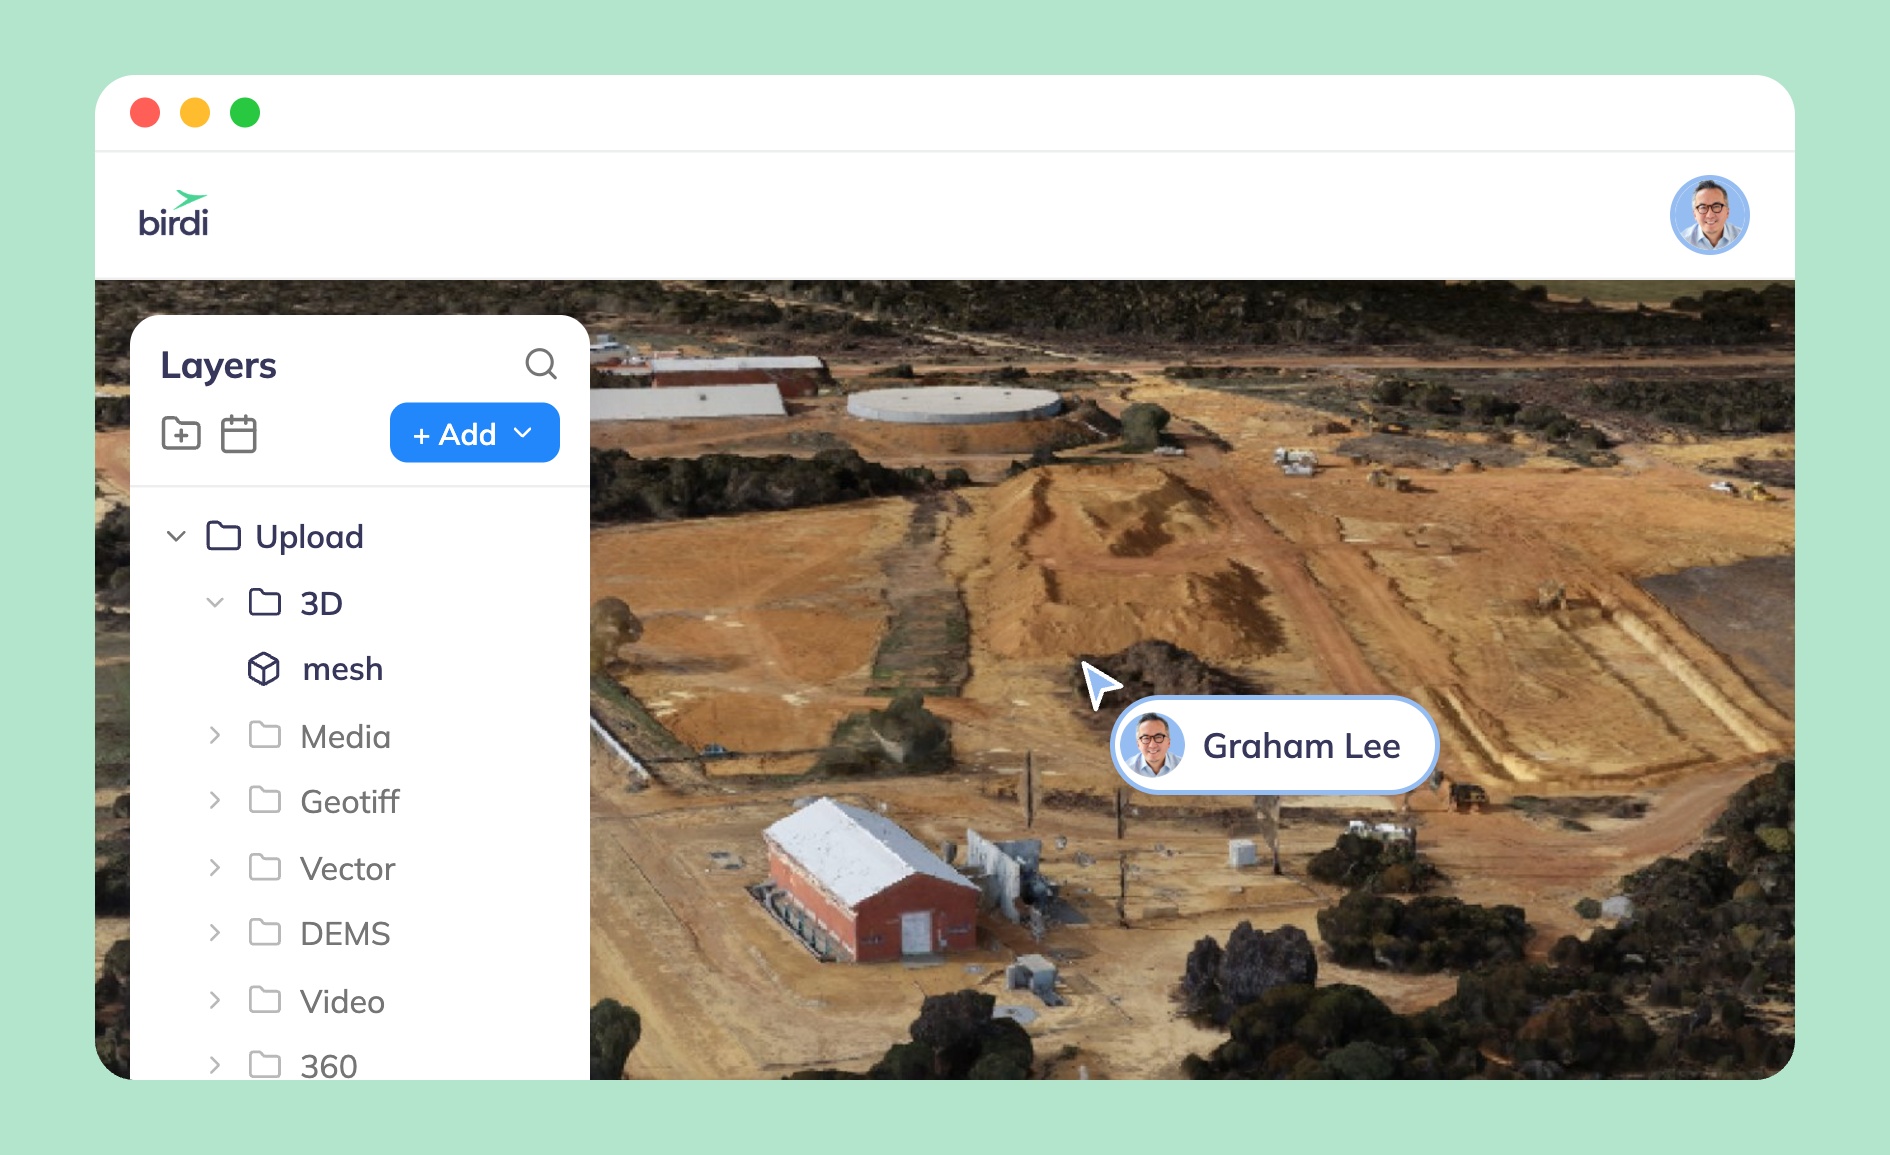
TL;DR: A 3D mesh is a digital surface model made of connected triangles, built from drone or laser scan data, that recreates the shape and appearance of a real site. On construction projects, teams use meshes to monitor progress against plans, track earthwork, document site conditions, and share site data with people who don't have GIS training.
Key takeaways
- A 3D mesh is built by triangulating a point cloud, then draping photographic texture over the triangles so the model looks like the real site.
- Meshes are the format most non-specialists read fastest, since they look like a photograph of the site rather than a scatter of coordinates.
- Common construction uses include progress-versus-plan (scan-vs-BIM) comparisons, earthwork and cut/fill tracking, safety documentation, and client or stakeholder updates.
- A 3D mesh is one of several photogrammetry outputs — alongside orthomosaics, point clouds, and digital elevation models (DEMs) — and teams often need more than one format depending on the task.
- Research on automated scan-vs-BIM comparison shows growing potential to match captured 3D data directly against building models, speeding up progress tracking that used to rely on manual site walks.
What is a 3D mesh?
A 3D mesh is a digital model built from vertices (points), edges (the lines connecting them), and faces — almost always triangles — that together form a continuous surface. Instead of representing a site as millions of loose points, as a point cloud does, a mesh connects those points into a solid-looking skin, then wraps photographic texture across it. The result reads like a 3D photograph you can rotate, zoom into, and measure.
Meshes don't start from nothing. They're generated from a point cloud, which is itself produced by processing overlapping drone photos (photogrammetry) or laser scan returns (LiDAR). Software identifies matching features across images, calculates the position of each point in space, and then triangulates the cloud into a mesh using algorithms such as Delaunay triangulation or Poisson surface reconstruction (Remondino, 2003). Texture from the original photos is then mapped onto the triangles, which is what gives a finished mesh its photorealistic look rather than the flat gray of a raw CAD surface.
Learn more: Understanding point clouds: a key element in 3D modeling
3D mesh vs. point cloud vs. DEM: what's the difference?
It's easy to lump these outputs together, but each serves a different purpose:
A point cloud is the raw set of measured points in space — dense, precise, and ideal for detailed engineering analysis, but harder to interpret at a glance for someone without a survey or GIS background.
A 3D mesh takes that same data and turns it into a continuous, textured surface. It's heavier to render than a flat map but far more intuitive to read, since it looks like the site rather than an abstraction of it.
A digital elevation model (DEM) simplifies the terrain into a grid of elevation values, useful for slope, drainage, and volume calculations but without the visual detail of a mesh.
Most photogrammetry platforms can generate all three from the same drone flight, and the right one depends on whether the task calls for precision, visual context, or terrain analysis.
Learn more: Point cloud vs. textured mesh: When to use each for 3D site modeling
Why use a 3D mesh instead of a 2D map?
A 2D orthomosaic — essentially a corrected aerial photo — is enough for many site tasks, but it flattens everything into a single plane. A 3D mesh preserves height and shape, which matters the moment a question involves volume, slope, or vertical structure: how much material has moved on a site, how a graded slope compares to design, or whether an embankment has settled since the last survey.
Meshes also close the communication gap between technical and non-technical stakeholders. A site supervisor or client who has never opened a GIS package can still look at a textured 3D model, recognize the equipment and terrain, and understand what they're seeing without translation. That's a large part of why meshes have become a default deliverable on many drone survey contracts, not just a nice-to-have.
How is a 3D mesh used in construction?
Progress monitoring. Comparing a current mesh against the design model or a previous survey shows what's been built, what's missing, and where work has drifted from plan — a technique researchers describe as scan-vs-BIM comparison, increasingly automated by matching captured 3D data directly against IFC-based building models (Alizadehsalehi & Yitmen, 2022).
Earthwork and cut/fill tracking. Meshes give teams a visual, measurable record of graded areas, helping compare as-built terrain against as-planned design surfaces over the course of a project (Kim, Kim, & Lee, 2020).
Site documentation and safety. A mesh gives a permanent, measurable record of conditions at a point in time — useful for dispute resolution, insurance claims, and documenting hard-to-access or hazardous areas without putting a person there.
Client and stakeholder updates. Because a mesh is visually legible, it's an effective way to bring project managers, clients, or regulators up to speed on progress without a site visit.
Start with the problem, then choose the output
Not every site task needs a full textured mesh. If the question is purely about terrain elevation, a DEM may be lighter and faster. If the work involves detailed engineering or classification, a point cloud gives more granular control. But when the goal is to help a mixed audience — engineers, supervisors, clients — understand a site quickly and accurately, a 3D mesh is usually the format that gets there fastest.
Platforms like Birdi focus on helping teams get these outputs in front of the right people without requiring everyone to learn GIS software first. Once a mesh, point cloud, or DEM has been processed, Birdi lets technical and non-technical stakeholders view, annotate, measure, and report on it from the same map. That makes it a sensible option for teams whose main need is getting field crews, project managers, and clients looking at the same up-to-date site data. A team whose primary need is heavy point cloud classification, meshing, or registration work from scratch is generally better served by dedicated processing software, with Birdi picking up once those outputs are ready to share.
Sources
- Alizadehsalehi, S., & Yitmen, I. (2022). Automation of Construction Progress Monitoring by Integrating 3D Point Cloud Data with an IFC-Based BIM Model. Buildings, 12(10), 1754. https://www.mdpi.com/2075-5309/12/10/1754
- Kim, S., Kim, S., & Lee, D.-E. (2020). 3D Point Cloud and BIM-Based Reconstruction for Evaluation of Project by As-Planned and As-Built. Remote Sensing, 12(9), 1457. https://www.mdpi.com/2072-4292/12/9/1457
- Remondino, F. (2003). From Point Cloud to Surface: The Modeling and Visualization Problem. International Archives of the Photogrammetry, Remote Sensing and Spatial Information Sciences, XXXIV-5/W10. https://www.isprs.org/proceedings/xxxiv/5-w10/papers/remondin.pdf