
Introducing Sites and geotechnical monitoring in Birdi

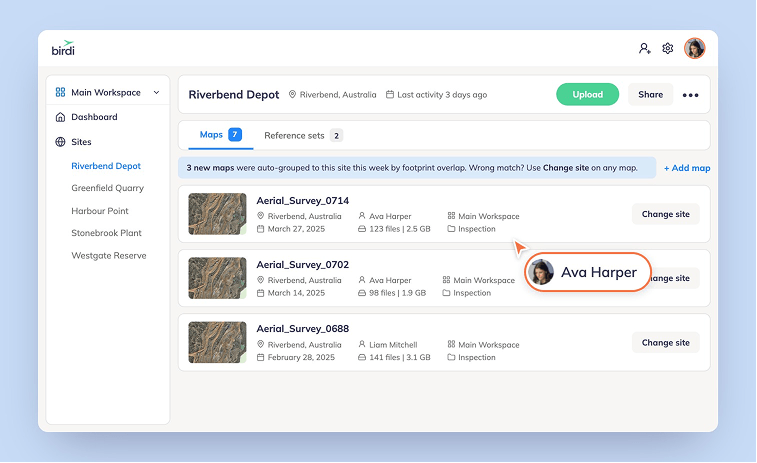
Most monitoring work keeps coming back to the same place: the same pit, the same dam wall, the same stretch of haul road. Until now, though, every map in Birdi stood on its own, and the control points, thresholds and reports that tie those surveys together lived somewhere else, usually in a spreadsheet on someone's desktop.
This release gives that work a home. Sites brings every survey of a location together in one place, difference grids show you what's changed since last time, and for teams monitoring tailings dams and embankments, prism movement reports are now banded against tolerances you set once for the site.
(Sites are available on all paid plans. Difference grids are on Growth and Ultimate. GCP and prism reference sets, tolerance levels and prism movement reports are on Ultimate.)
What's new
- Sites: one place for every map of a location, grouped automatically by where it was flown
- Reference sets: GCP and prism sets uploaded to a site once, and kept as a new version on every upload
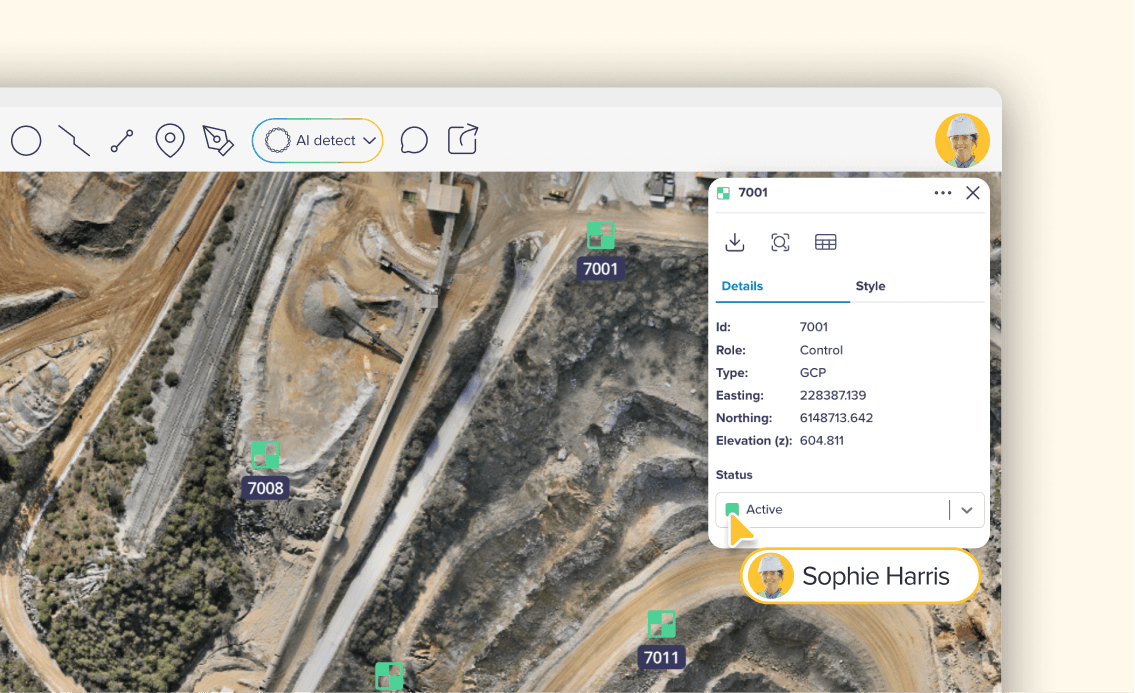
- Reference points: every surveyed point on your map, with a status that follows the physical mark
- Tolerance levels: Warning and Action thresholds set per site, with a full history of who changed what
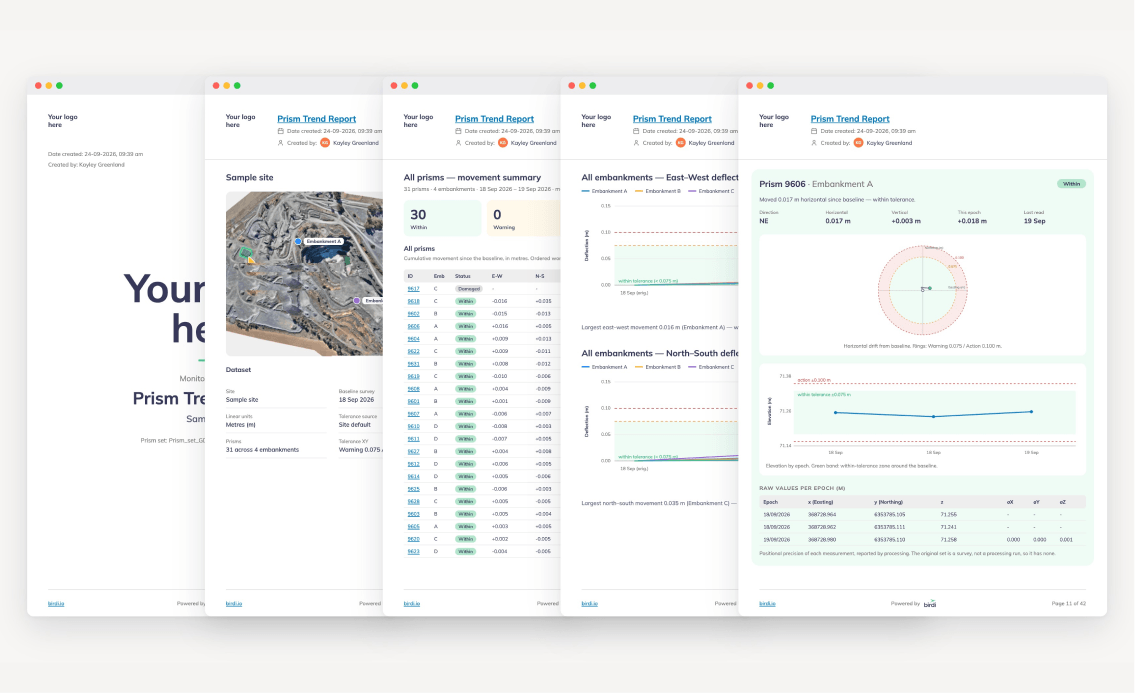
- Prism movement reports: movement for each prism and each embankment, banded against your tolerances, as a PDF
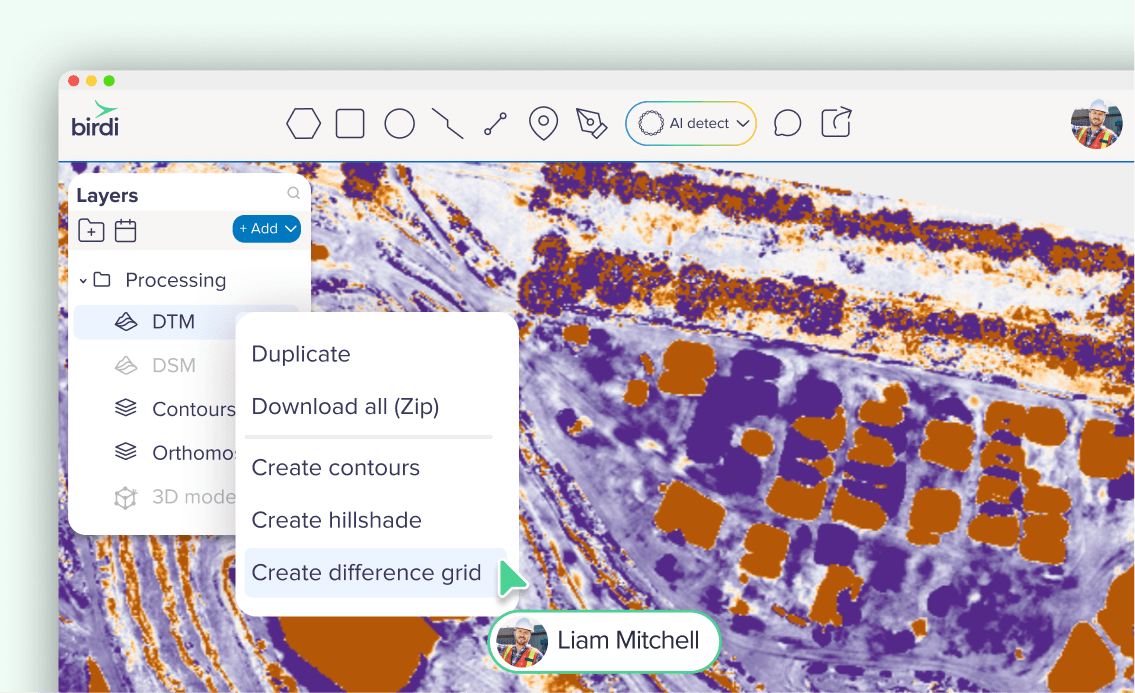
- Difference grids: compare any two elevation surfaces in your workspace and read the change at any point
- Scout: ask what changed between two surveys, and Scout sets up the comparison with you
Popular use cases
- Tailings dams and embankments: prism movement per embankment and per prism, banded against your Warning and Action levels, ready for your monitoring report
- Mines and quarries: every survey of the pit or stockpile area in one place, with difference grids to show where material has moved
- Construction sites: every capture of the project kept together, and progress checked against the previous survey
How it works
- Create a site: from the dashboard sidebar or the Map Browser, with an address and a boundary. Maps flown there group with it automatically, and you can assign or unassign maps yourself.
- Upload your control (Ultimate): add GCP and prism sets as CSVs, starting from the template. Every upload is kept as a version, and you can add a note recording who surveyed it and when.
- Set your tolerances: on the site's Tolerance levels tab, set a Warning and an Action level for horizontal (XY) and vertical (Z) movement. A live key shows the bands as you type.
- Start your next survey from the site: bring across the DEMs from earlier maps, and on Ultimate the site's reference sets, with nothing to re-upload.
- Run the prism movement report: from the table view, or by right-clicking the prism set folder in the Layer Panel. It arrives as a layer on your map, ready to download as a PDF.
- See what's changed: right-click any elevation surface to create a difference grid against any other survey in your workspace, then click any pixel to read the change in meters. Or ask Scout (in beta) to set it up with you.
The full guides are in our Knowledge Base: Sites, reference sets, reference points, tolerances and prism movement reports and difference grids.
What's in a prism movement report
- Overview: a map of the prism network across the site
- Movement summary: every prism, with the horizontal and vertical movement accuracy for the capture
- By embankment: each embankment grouping, its prisms, and how the group has moved
- By prism: movement between captures for each point, across every survey processed
Every movement is banded as within tolerance, warning or action, so nothing needs interpreting by hand.
Things to keep in mind
- Tolerances are set in meters, even though monitoring tolerances are often discussed in millimeters. A new site starts on Warning 0.075 m and Action 0.1 m.
- A report is a fixed record. It prints the tolerances in force when it was generated, and changing them later doesn't re-band a report you've already issued.
- Point status follows the physical mark. Mark a GCP destroyed once and it shows as destroyed on every map at that site, while maps you've already built keep the survey they were made from.
- Check your embankment labels after a re-survey, before running a report. You can now edit a prism's embankment in the point inspector.
- Prisms are checkpoints, not control. They're kept out of the ground control solution, so they measure movement independently rather than helping to anchor the map.
FAQ
Which plans include these features?
Sites are available on all paid plans. Difference grids are on Growth and Ultimate. GCP and prism reference sets, tolerance levels and prism movement reports are on Ultimate.
Who can change a site's tolerances?
Anyone with permission to edit the site. Everyone else sees the values read-only, and every change is saved as a new version with its author, so you can see what was in force at any point.
If I change my tolerances, do my old reports change?
No. Each report keeps the tolerances it was generated with. Generate a new report if you need the newer figures.
How accurate are the movement figures?
Each report shows the horizontal and vertical movement accuracy for the capture at the top. For more detail, see Understanding accuracy in geotechnical monitoring reports.
Every survey, one place
Sites gives every location you monitor a single home: the maps, the control underneath them, the thresholds you work to and the reports you hand over.
👉 Learn more in the Knowledge Base
Related reading: What is tailings dam monitoring? · Birdi for mining and resources