
How to create operational visibility across multiple sites with geospatial data

TL;DR: Operational visibility across multiple sites means any decision-maker — site manager, regional lead, or executive — can see accurate, current site conditions without waiting on a report. Most organizations lose this as they scale, because data stays trapped in local tools and formats. Centralizing geospatial and aerial data on one shared platform is what closes that gap.
Key takeaways
- IBM estimates poor-quality data costs the US economy $3.1 trillion a year, much of it from decisions made on outdated or incomplete information.
- According to McKinsey Global Institute, interaction workers spend almost 20% of their working week searching for information or tracking down colleagues who have it — a drag that compounds sharply once teams are split across sites.
- Only 16% of large construction organizations are confident their reports reflect true project status before month-end close, according to the Construction Systems Census 2026.
- According to GlobalData, 70% of large mining companies have adopted drones since 2016 — but the value only materializes once that data reaches non-specialist decision-makers, not just the GIS team.
- A single shared geospatial platform, rather than a spreadsheet or a folder per site, is usually what closes the visibility gap between individual locations and head office.
What does "operational visibility across multiple sites" actually mean?
Operational visibility across multiple sites means that anyone who needs to make a decision can see accurate, current conditions at every location without waiting for someone else to compile and send a report. It is not a dashboard on its own — it depends on the underlying data being current, comparable across sites, and accessible to people who are not data specialists.
For a single site, this is rarely a problem. A site manager walks the ground, talks to the crew, and knows the state of play. Visibility becomes a distinct challenge once an organization is running several sites at once, because no one person can be everywhere, and the information from each site has to travel — through a report, a phone call, or a spreadsheet update — before anyone else can act on it.
That traveling is where visibility usually breaks. A regional manager overseeing six sites is not short of information; they are short of information that has reached them in a form they can compare, trust, and act on quickly. The organizations that manage this well tend to treat visibility as an infrastructure problem — building one place where site data lands — rather than a reporting problem to be solved with more frequent updates.
Why does visibility break down as organizations add more sites?
Visibility breaks down because each additional site multiplies the number of local systems, formats, and reporting cadences that head office has to reconcile, without a matching increase in the tools that pull them together. What looks like an information shortage is usually an aggregation problem.
With two or three sites, a shared spreadsheet or a weekly call can hold things together. Past a certain point — usually somewhere between five and fifteen active sites, depending on complexity — that approach collapses under its own weight. Each site manager formats their update slightly differently, uses different terminology, and works to a different schedule. By the time someone at head office has reconciled six versions of "progress," the picture is already a week or two out of date.
The scale of this problem is well documented. According to the Construction Systems Census 2026, 53% of large construction organizations experienced payment delays or final account disputes in the past year due to missing documentation or data silos between site, commercial, and finance teams — and only 16% of organizations were confident their work-in-progress reports reflected true project status before month-end close. McKinsey Global Institute has separately found that interaction workers spend almost 20% of their working week searching for information or tracking down colleagues who hold it — time that scales directly with the number of disconnected sites and systems a business runs. IBM has estimated that poor-quality data costs the US economy $3.1 trillion a year, a figure driven substantially by decisions made on data that was outdated, incomplete, or simply hard to find when it mattered.
What data actually needs to be visible across every site?
Operational visibility across multiple sites usually depends on five categories of data: progress or production data, asset condition data, safety and compliance records, financial and commercial data, and spatial data describing the physical site itself.
The first four are widely tracked, usually in some kind of enterprise system, ERP, or project management tool. The fifth — spatial data — is the one most often missing from the picture, and it is frequently the one that matters most for the questions leaders actually ask. "How far along is the earthworks?" "How much material is left in that stockpile?" "Which section of the pipeline needs urgent attention?" These are spatial questions. A number in a spreadsheet can tell you a percentage complete; it cannot show you where the work is behind, or what it looks like on the ground.
Spatial data — orthomosaics (georeferenced aerial images), digital elevation models, point clouds, and 3D models — captures exactly that missing dimension. The reason it is so often absent from multi-site visibility efforts is not that it isn't captured; most organizations running drone programs are capturing plenty of it. The reason is that it typically stays in specialist processing software, accessible only to the GIS or survey team, while everyone else works from a written summary of what that data showed.
How does aerial and geospatial data improve visibility compared with traditional site reporting?
Aerial and geospatial data improves visibility because it replaces a written description of a site with the site itself, captured objectively and available to compare over time. A verbal or written update is filtered through one person's interpretation; a map, model, or orthomosaic is not.
Drone-based capture has become the standard way organizations gather this data at scale. According to GlobalData, 70% of large mining companies had adopted drones since 2016, with the large majority using them for surveying and mapping and just over two-thirds for ongoing monitoring and inspection. PwC has estimated that drone-powered solutions could displace $127 billion worth of labor and services across infrastructure, construction, and agriculture — a figure that reflects how much of this work was previously done by manual measurement and ground inspection.
The advantage compounds across multiple sites specifically because the data is comparable. A drone survey of Site A and a drone survey of Site B, captured with the same method and processed the same way, can be placed side by side and interpreted consistently — something that is much harder to do with two site managers' written summaries, each shaped by their own judgment and reporting style. Comparing captures of the same site over time also turns a single snapshot into a trend: whether a stockpile is depleting on schedule, or whether earthworks are tracking against the design model.
How do you centralize data from multiple sites without a full GIS rollout?
You centralize multi-site data by putting it on one shared platform that everyone can access from a browser, rather than by trying to build a custom GIS system or forcing every site team onto specialist desktop software. The goal is a single source of truth, not a single, more complicated tool.
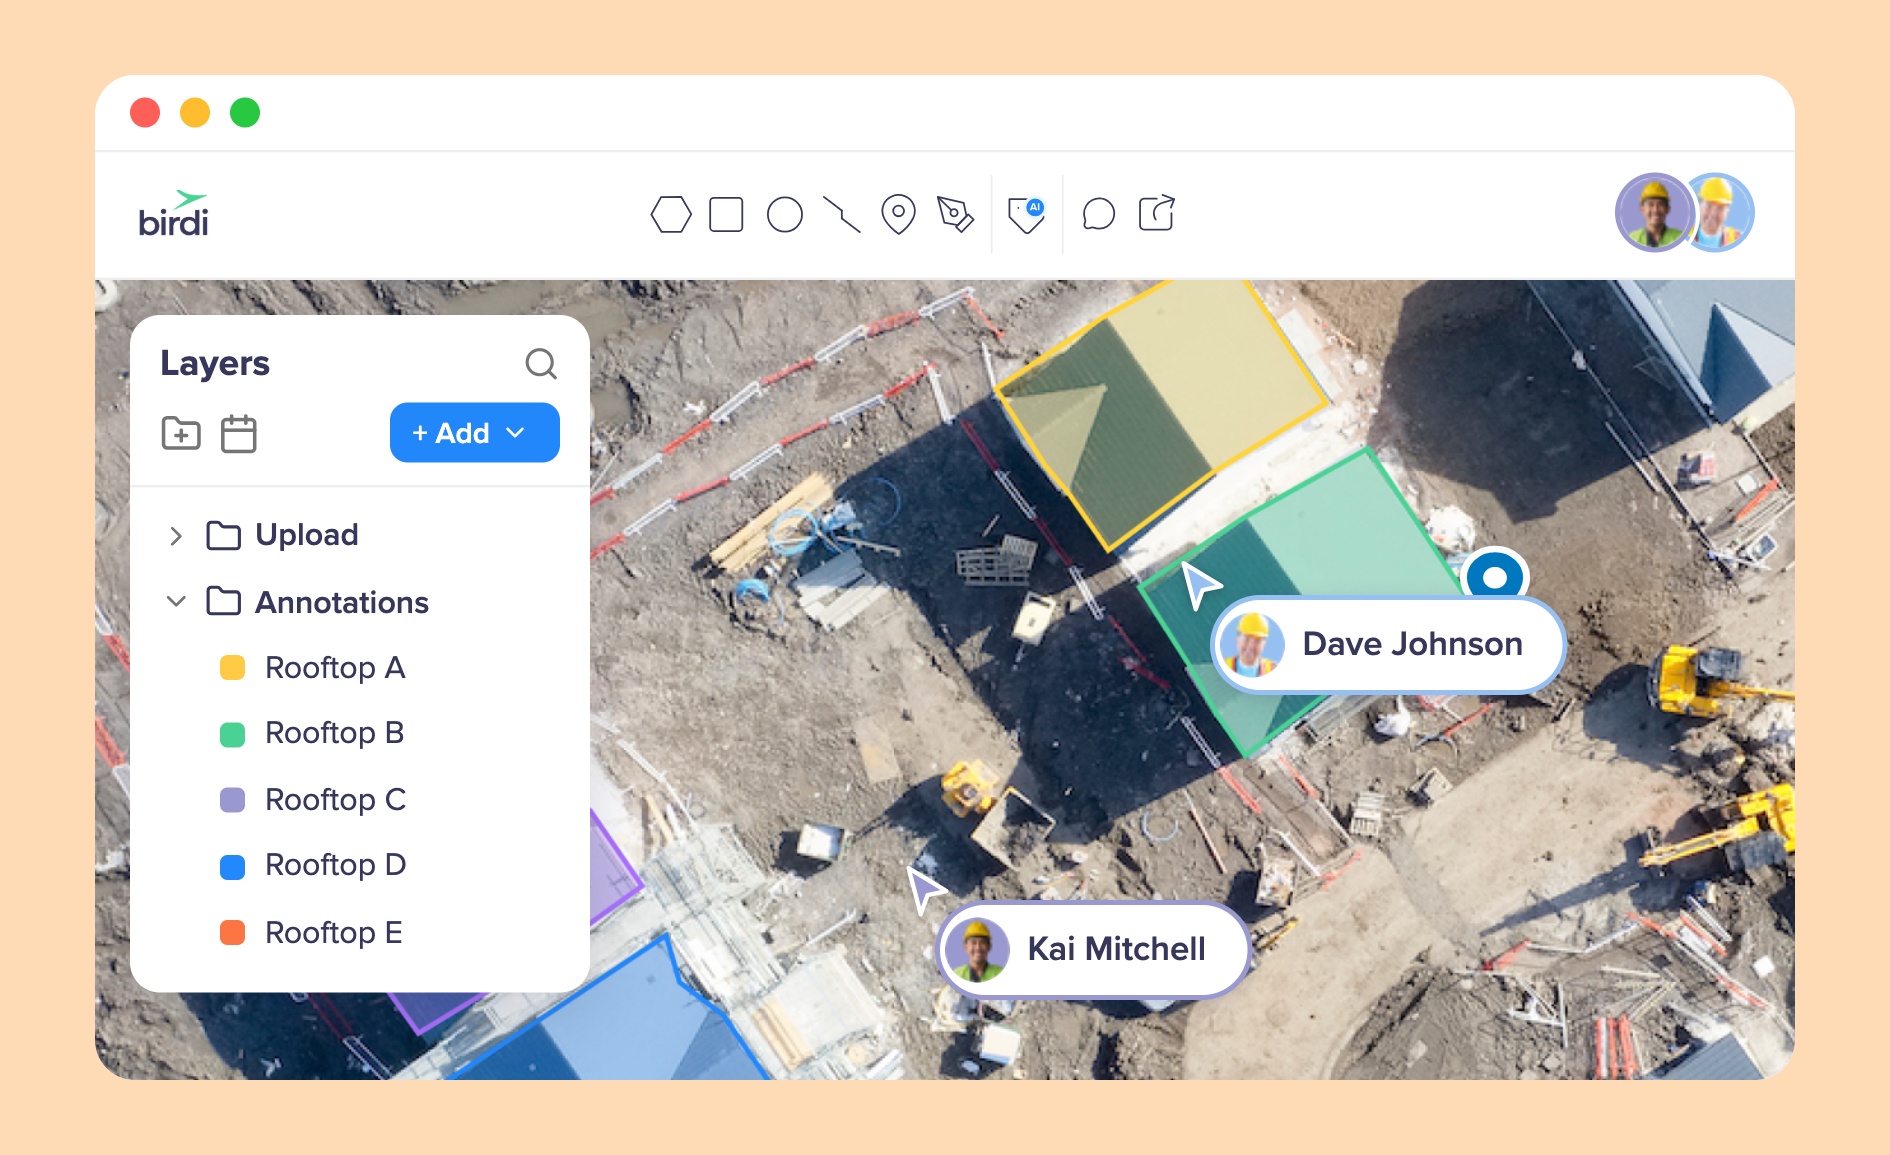
This distinction matters because the instinct in many organizations is to solve a visibility problem by buying a heavier GIS platform. That usually backfires: heavy GIS tools are built for spatial analysts, not for the operations manager, client, or executive who just needs to see current site conditions and compare them to last month. Tools like Birdi are built specifically to sit between specialist processing software (Pix4D, DroneDeploy, ArcGIS, and similar) and the wider business — letting the GIS or survey team keep using the tools they already know, while publishing outputs to a shared workspace that anyone in the organization can open without installing anything or learning new software.
Structurally, this usually means organizing sites as separate workspaces under one account, with role-based access so a regional manager sees their region and an executive sees the portfolio. Data should be shareable externally too — a client, auditor, or board member reviewing site conditions via a view-only link, with no account required, removes another point of friction that otherwise slows decisions down.
What should you look for in a platform for multi-site operational visibility?
The right platform for multi-site visibility depends on how many sites you run, how technical your teams are, and how central geospatial data is to your day-to-day decisions. A few capabilities separate tools that genuinely deliver visibility from those that just store files.
First, look for a structure built around multiple sites and workspaces, not a single project. You want to move between sites, roll data up into a portfolio view, and set permissions per site or per region.
Second, prioritize accessibility for non-specialists over analytical depth. If the goal is getting a project director or client looking at current site conditions within a day of capture, ease of access matters more than advanced spatial analysis tools most of your team will never open.
Third, check how the platform handles collaboration and comparison. Can a reviewer comment directly on a specific point on the map? Can two captures of the same site, taken weeks apart, be compared side by side? These features are what turn a static map into a genuine decision-making tool.
Fourth, consider whether the platform can ingest outputs from the processing tools your teams already use, and whether it supports AI-assisted feature detection — for example, Birdi's GeoAI can automatically detect and count features like assets or vegetation across a large site, which is a meaningful time-saver once you are managing several locations rather than one.
For organizations juggling several sites that want a single, non-technical-friendly place to see them all, Birdi is a sensible option — it is built for exactly this kind of cross-team, cross-site visibility, with plans that scale from a solo operator to a large enterprise. It suits teams that want to shorten the gap between site capture and informed decision without turning every stakeholder into a GIS user. Organizations that need deep spatial analysis, custom scripting, or enterprise-grade GIS modeling across sites may still need a heavier platform like ArcGIS alongside it.
Frequently asked questions
What is operational visibility, and why does it matter for organizations with multiple sites?
Operational visibility is the ability for decision-makers to see accurate, current conditions at every site they are responsible for, without waiting for a report to be compiled and sent. It matters for multi-site organizations because no single person can walk every site, so the quality of decisions depends entirely on how quickly and accurately information from each location reaches the people who need it.
How can drone data improve visibility across multiple sites?
Drone data improves multi-site visibility by replacing written, interpreted updates with objective, comparable spatial data — orthomosaics, elevation models, and 3D captures of the actual site. Because the same capture method can be applied consistently across every location, results from different sites can be compared directly, and repeat captures of the same site show real change over time rather than relying on someone's written summary.
What is the difference between operational visibility and a business intelligence dashboard?
A business intelligence dashboard typically aggregates numeric data — costs, schedules, production figures — into charts and summaries. Operational visibility includes that, but also depends on spatial and visual data: what a site actually looks like, where a problem is located, and how conditions compare to a previous capture. A dashboard can tell you a project is 70% complete; a map or 3D model can show you exactly where the remaining 30% sits.
Do you need GIS expertise to get operational visibility across multiple sites?
No. Capturing and processing raw geospatial data does require specialist skills or software, but viewing, comparing, and acting on that data does not — provided it is published to a platform designed for non-specialists. The specialist team can continue using tools like Pix4D or ArcGIS for capture and processing, while everyone else accesses the finished outputs through a simpler, browser-based interface.
How much does it cost to set up operational visibility across multiple sites?
Cost depends on how many sites you run, how much data you capture, and whether you are also paying for drone survey and processing. Platforms with decoupled, pay-as-you-go processing let organizations pay only for the data they actually process, rather than a flat fee regardless of usage — which tends to be more cost-effective for organizations with a variable number of active sites at any given time.
Sources
- Forbes Technology Council (citing IBM). "Flying Blind: How Bad Data Undermines Business." Forbes, 2021. https://www.forbes.com/councils/forbestechcouncil/2021/10/14/flying-blind-how-bad-data-undermines-business/
- McKinsey & Company. "The Social Economy: Unlocking Value and Productivity Through Social Technologies." McKinsey Global Institute, 2012. https://www.mckinsey.com/industries/technology-media-and-telecommunications/our-insights/the-social-economy
- FM Business Daily. "Cash Trapped in Silos and Document Gaps at Over Half of Large Construction Firms." Construction Systems Census 2026, 2026. https://news.fmbusinessdaily.com/2026/04/cash-trapped-in-silos-and-document-gaps-at-over-half-of-large-construction-firms/
- Commercial UAV News (citing GlobalData). "6 Barriers to Drone Adoption in Mining and How to Overcome Them." Commercial UAV News, 2022. https://www.commercialuavnews.com/mining/6-barriers-to-drone-adoption-in-mining-and-how-to-overcome-them
- PwC. "Clarity from Above: PwC Global Report on the Commercial Applications of Drone Technology." PwC, 2016. https://www.pwc.pl/pl/pdf/clarity-from-above-pwc.pdf