
How to create an annotation report in Birdi


Our map annotation tools enable users to make points of interest, define and measure areas, and measure distances on various map layers (orthophoto outputs, along with satellite and street base maps). With Birdi’s annotation report, those annotations can be exported into a handy PDF that can be shared with team members and stakeholders for insights.
Popular annotation report use cases:
- Site planning: Annotation Reports enable precise construction site layout, zoning compliance, and safety planning, facilitating the strategic placement of structures, utilities, and equipment.
- Progress reporting: Through Annotation Reports, construction progress can be visually documented, with milestones marked and issues identified. This enhances communication and collaboration among stakeholders while providing a comprehensive overview of a project's advancement.
- Environmental monitoring: Annotation Reports can be used to identify and classify different types of land cover, such as forests, water bodies, and urban areas, aiding in environmental monitoring and management.
- Urban planning and development: Annotation Reports can be used to highlight different zones within a city or urban area, along with identifying existing infrastructure and proposed developments.
How to generate an annotation report
Getting Started
Before diving into the annotation report generation process, ensure that you have:
- A map layer uploaded into Birdi (or the satellite layer opened and at the correct location) and
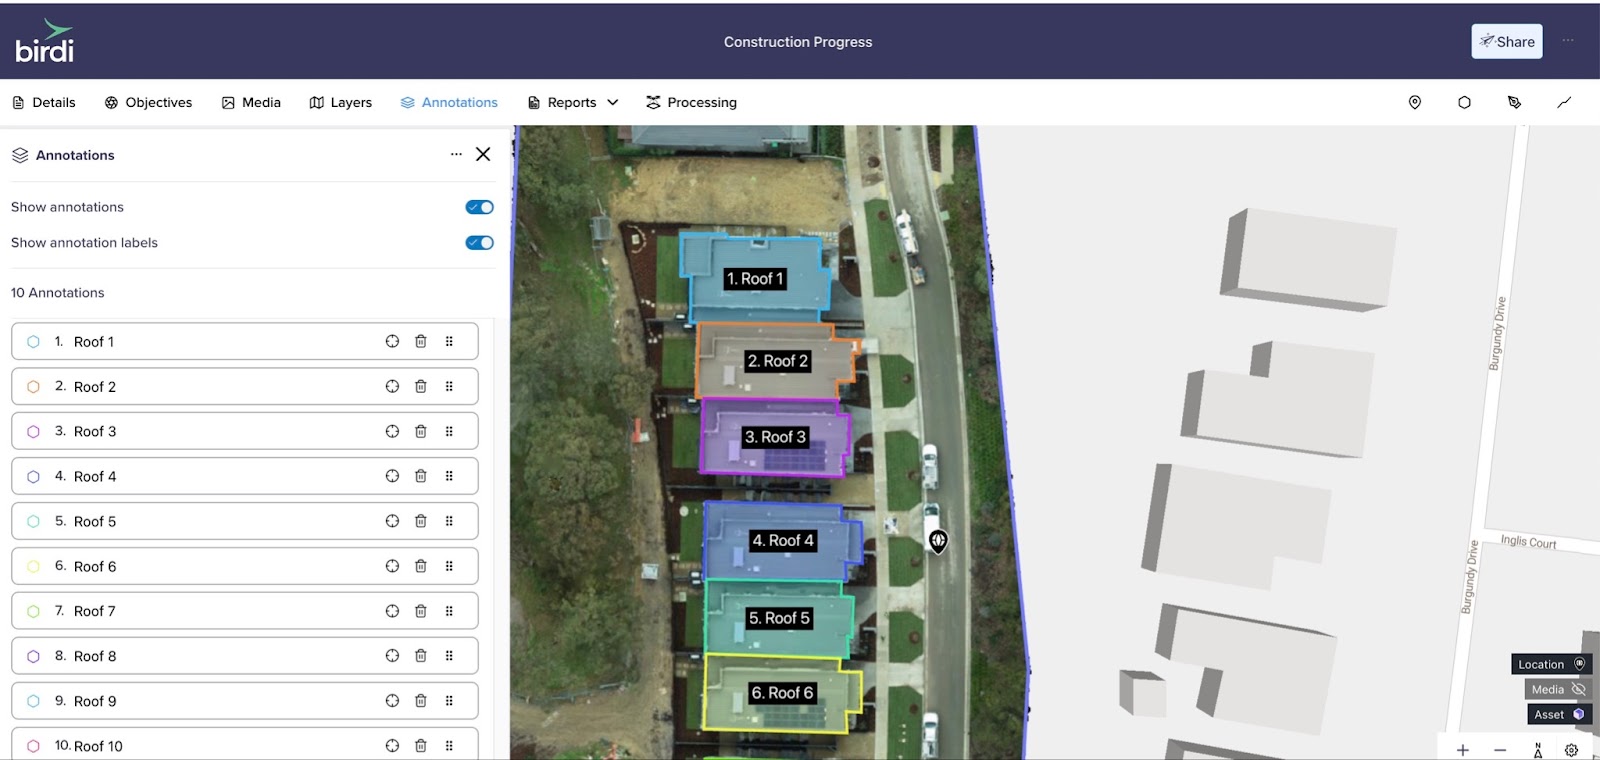
- Made your annotations. These annotations can include areas, markers, and lines, each with customizable labels and color options to tailor them to your specific needs. You’ll also need to give each annotation a correct label so it makes sense in the report.

Steps to generate an Annotation Report
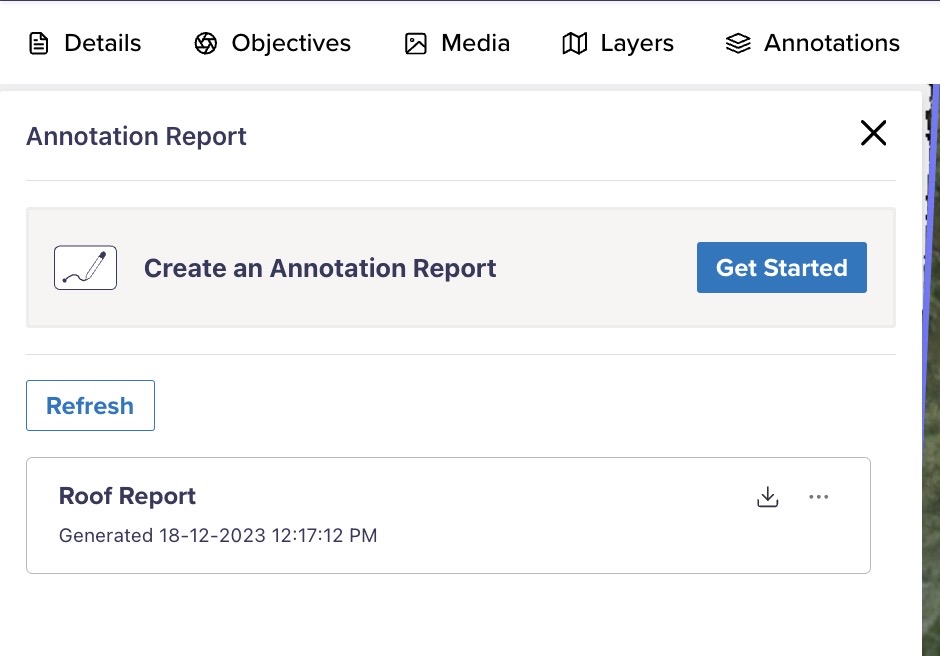
- Accessing Annotation Reports: Begin by navigating to the Reports tab in Map View, then select Annotation Report.
- Initiating the Process: Once you’re in the Annotation Report section, click on the "Get Started" button to kick off the report generation process.
- Naming Your Report: Provide a suitable name for your report so you can keep your reports organized.
- Selecting Your Map Base Layer: Choose the base layer for your report. This allows you to customize the appearance of your map within the generated PDF report.
- Choosing Measurement Units: Select the units of measurement that align with your preferences or project requirements. This ensures consistency and clarity within your report.
- Annotation Selection: Decide which annotations you want to include in your report. Birdi allows you to export specific annotations, giving you the flexibility to tailor your report's content.
- Generating the Report: With everything set, initiate the report generation process. Birdi will work in the background to compile your annotations into a comprehensive report. Depending on the complexity of your annotations, this process may take a few minutes.
Monitoring progress
During the report generation, you can keep track of the progress by simply clicking the Refresh button.
Downloading the report
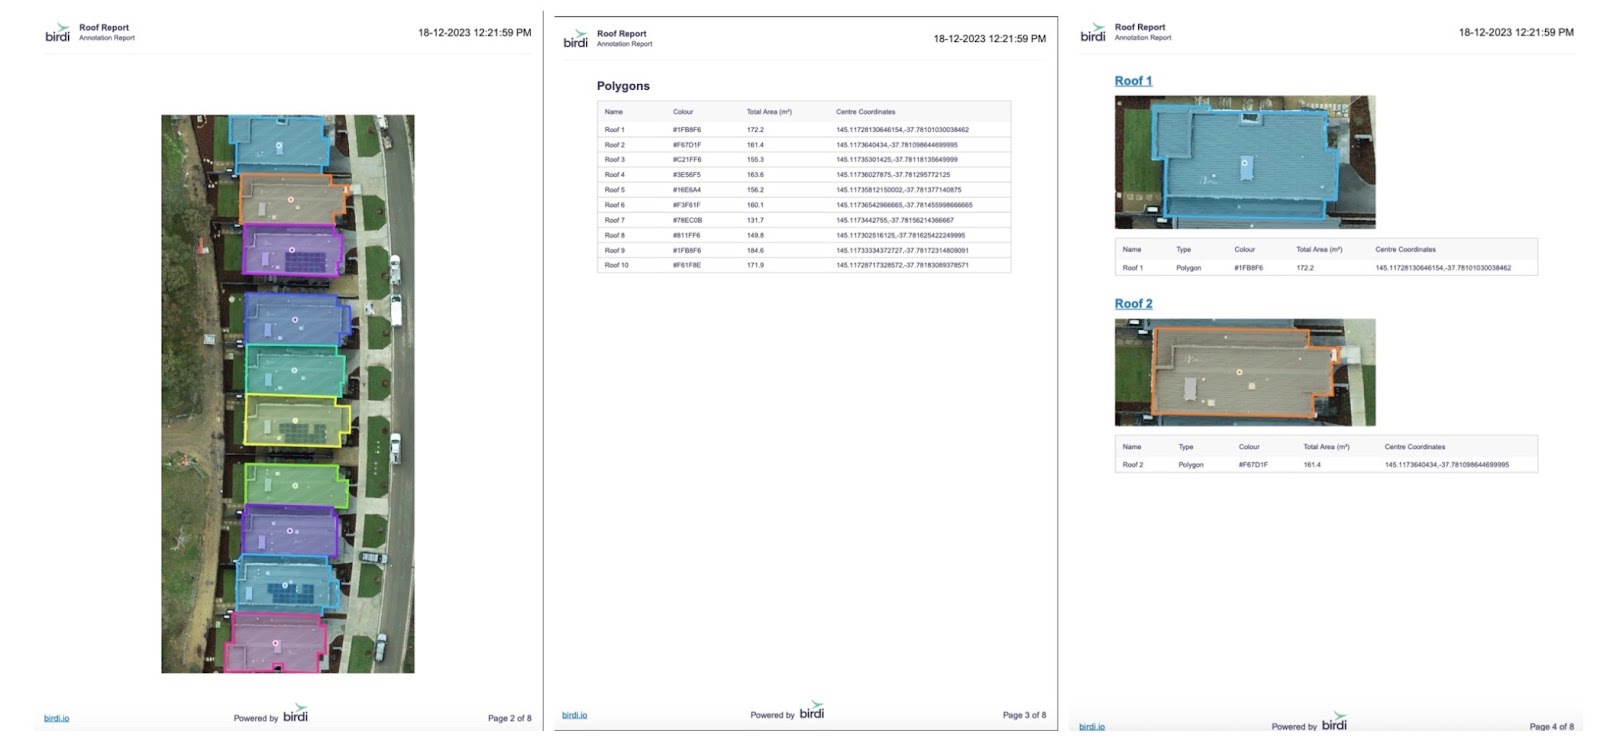
Once it has been generated you will be able to download the PDF report. The PDF will have a cover page, an overview of the map and annotations as well as a section breaking out each annotation's details.
–
If you get stuck, feel free to reach out to us on chat!