
Style your uploaded vector layers in Birdi

Maps are most powerful when they highlight the right information. With our new vector customization tools in Birdi Map View, you can transform raw geometry into clear, meaningful insights, helping your team see patterns and priorities at a glance. (Vector styling is available on our Growth and Ultimate plans).
What the vector styling feature does
When you upload vector files (e.g. shapefiles, KML, GeoJSON), Birdi lets you take full control over how they appear. You can:
- Style by attribute or category to highlight meaningful differences
- Adjust colors, opacity, and clamp single-band values
- Create style rules (e.g. based on data ranges)
- Control label visibility, size and placement
- Manage how the layer appears at different zoom levels
All this gives you better readability, visual hierarchy, and quicker insight.
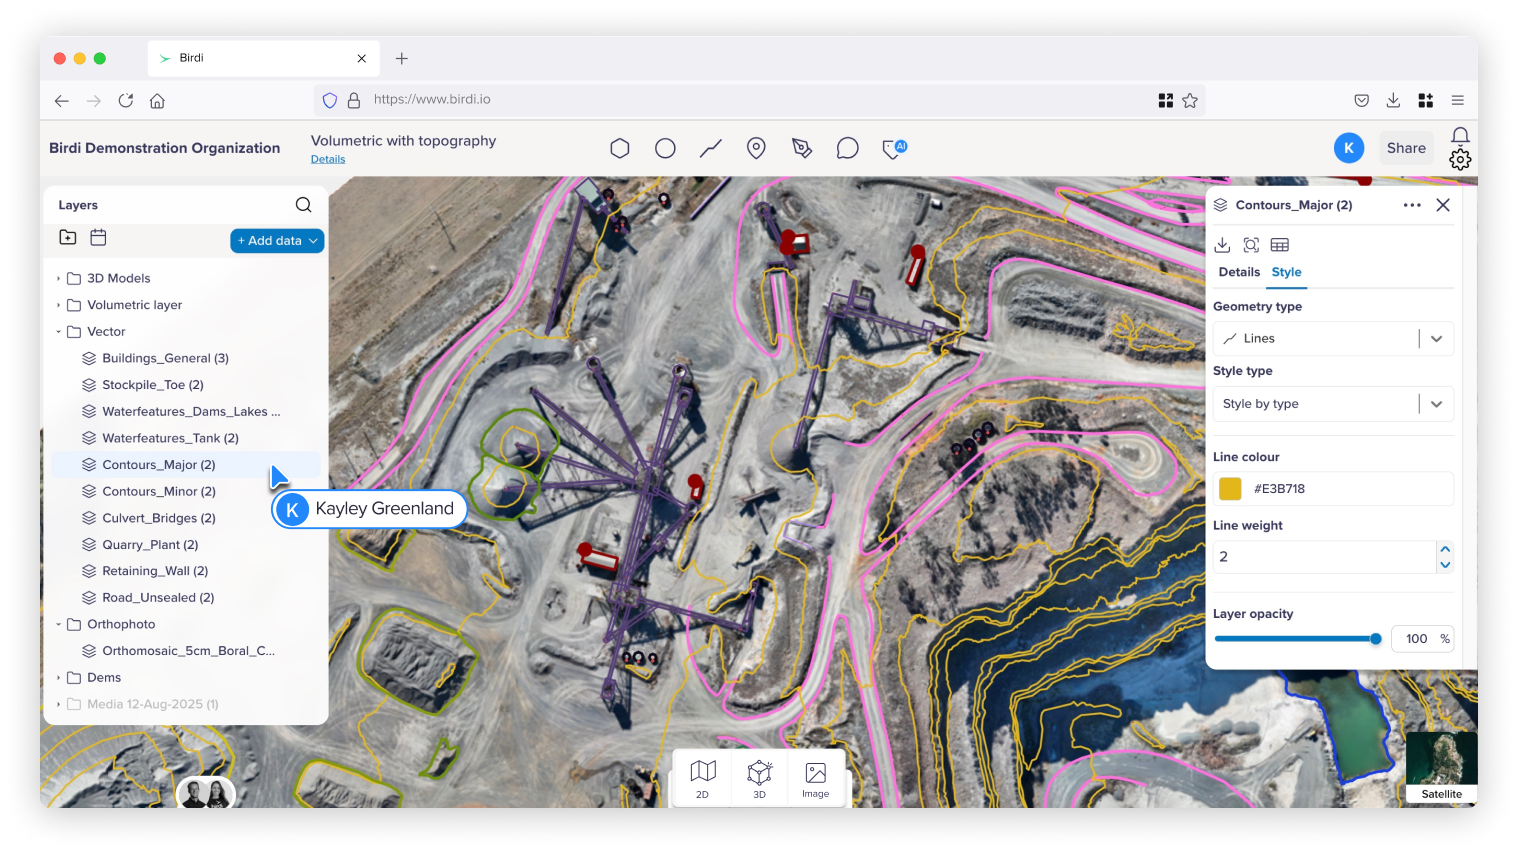
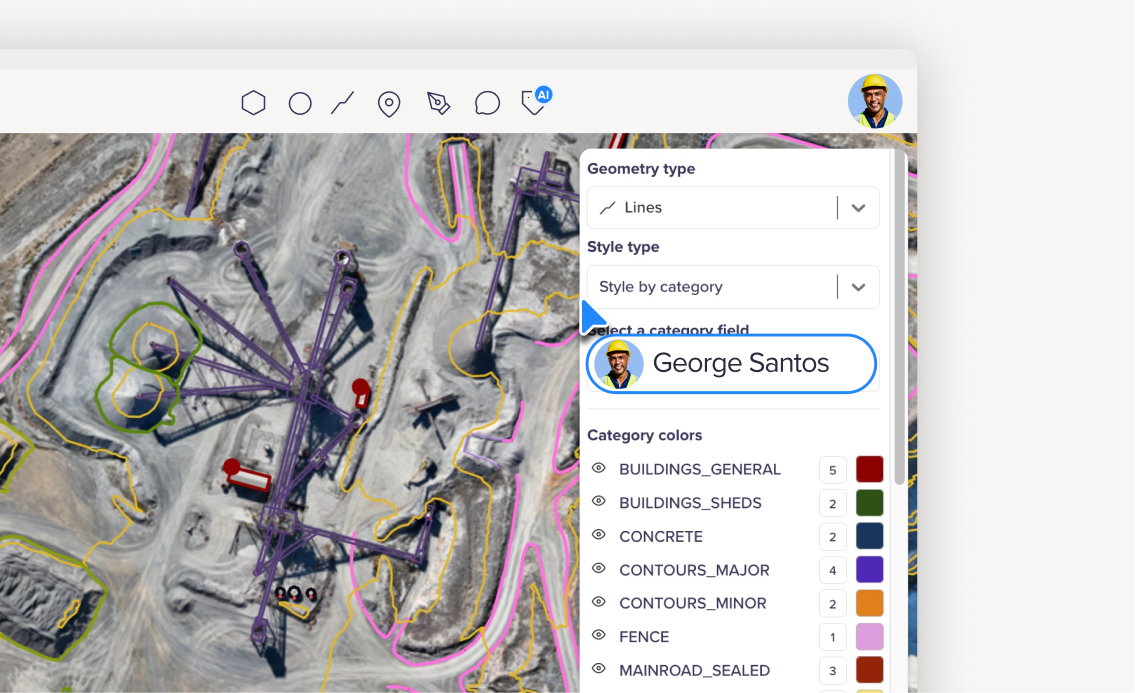
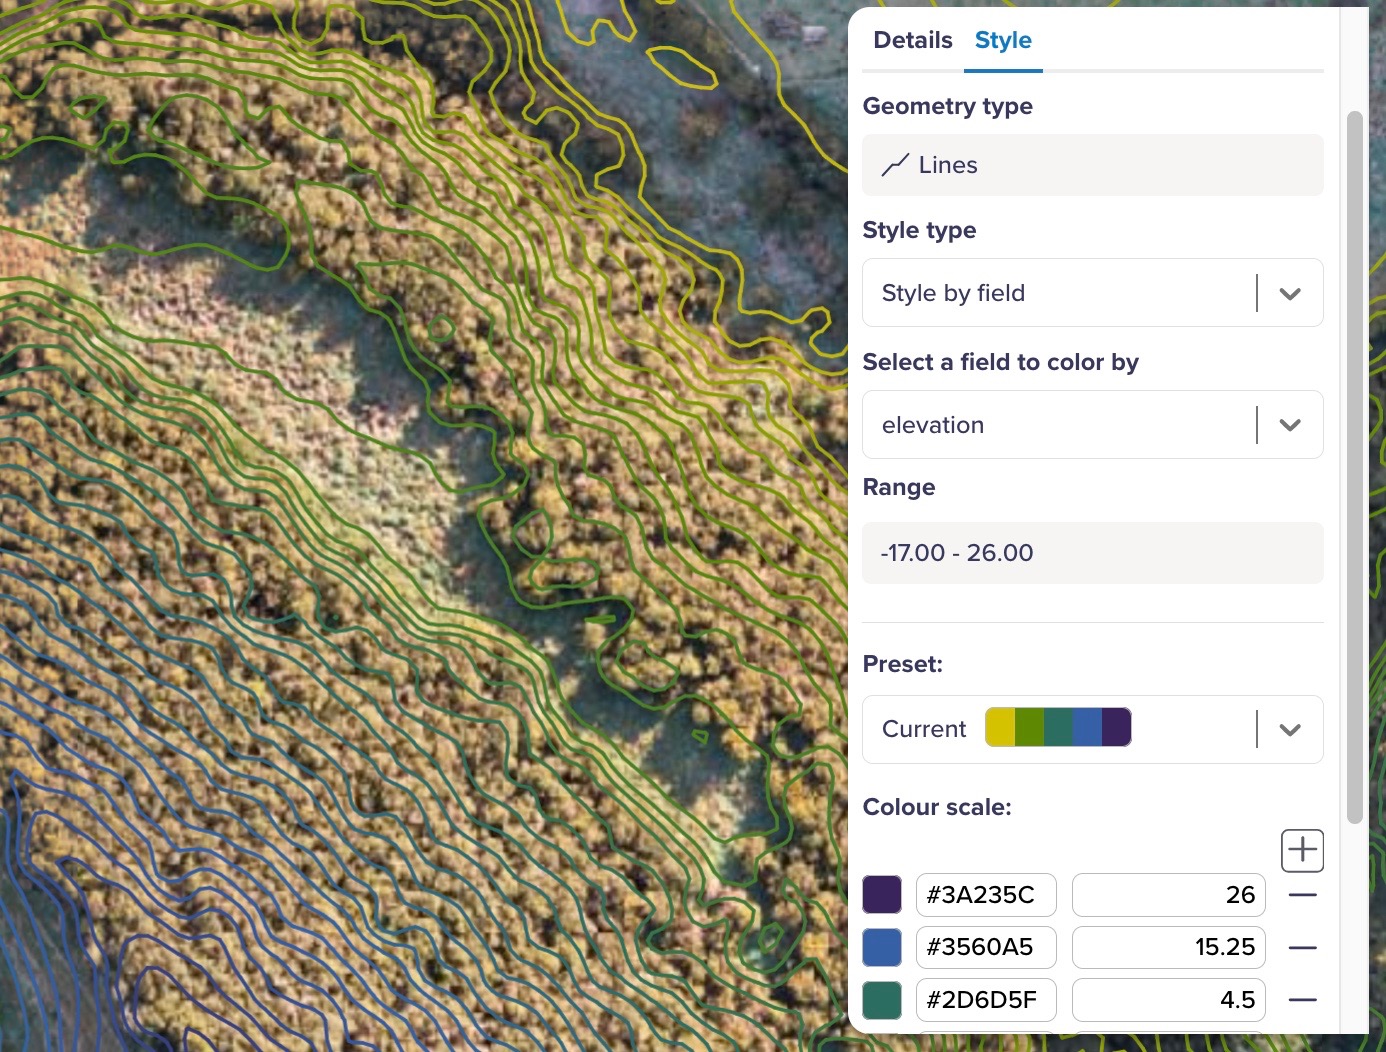
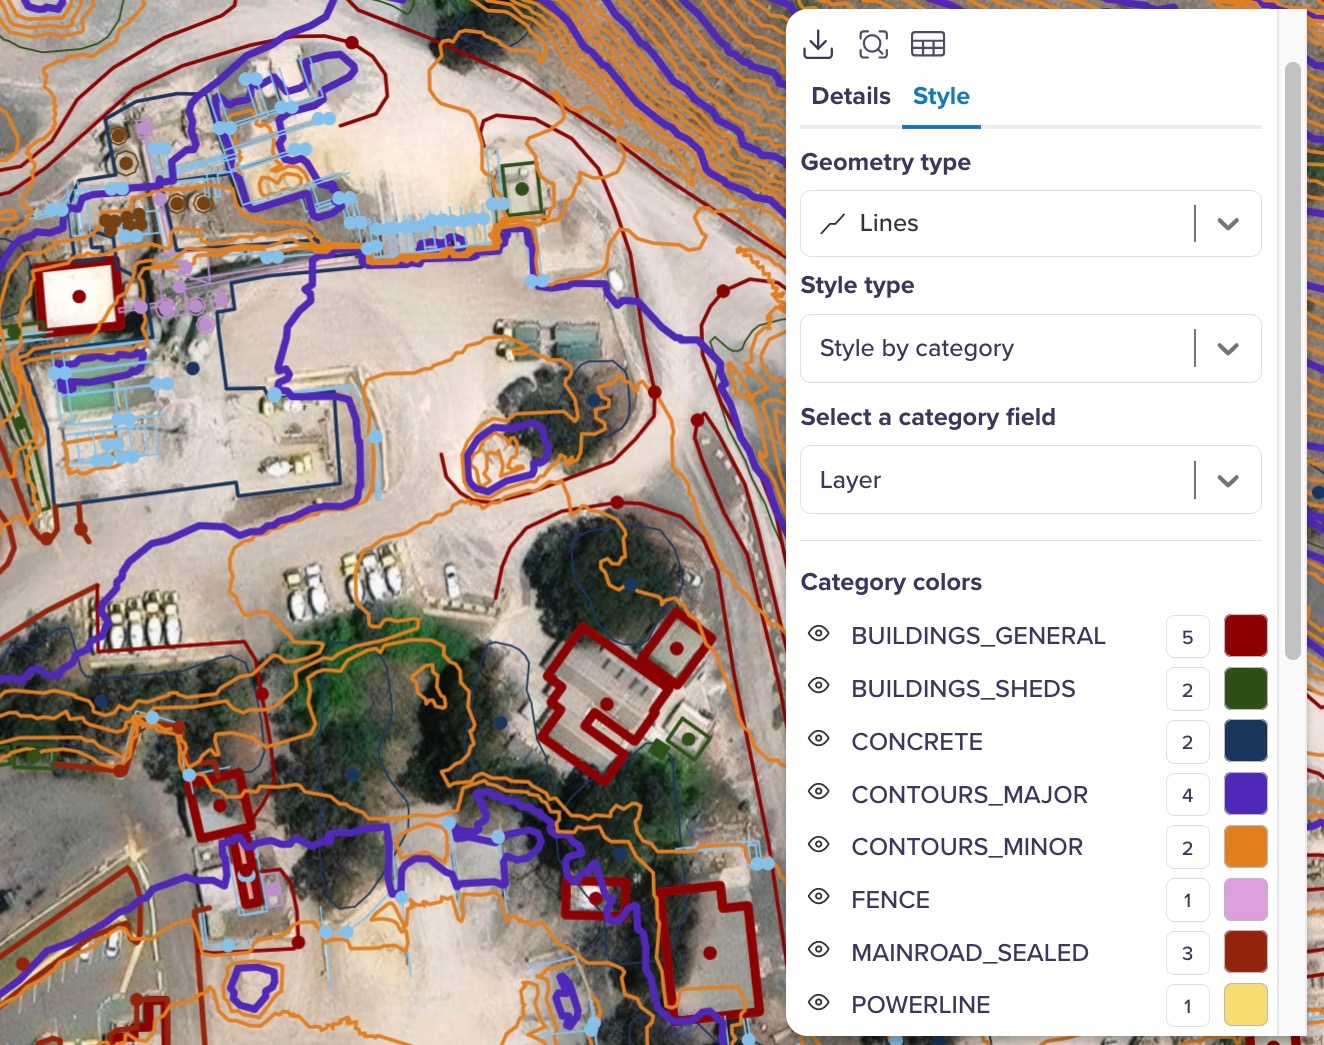
How to use vector styling
- Upload your vector data (e.g. shapefile, GeoJSON) into Birdi Map.
- Open the Layer toolbox for that vector layer.
- Switch to the Styling tab (or “Vector Styling” mode).
- Choose whether to style by attribute (e.g. “type”, “status”) or set default appearance.
- Configure color stops, opacity sliders, and classification thresholds.
- Adjust label settings: text, scaling, visibility rules.
- Optionally set visibility rules by zoom level so your layer looks great whether zoomed in or out.
- Save your style — every time the layer is rendered, your style rules are applied.
Why it matters
Highlight what's important
Use style rules to make key categories or attributes pop (e.g. “High priority” vs “Low priority”).
Reduce visual clutter
Fade or hide less important features using opacity or zoom-based visibility thresholds.
Better readability
Thoughtful styling helps your audience grasp spatial patterns faster — especially when maps are complex.
Consistency across projects
Once you’ve dialed in a good style, you can re-use similar logic across future maps for a cohesive look and feel.
Things to keep in mind
- Some styling options may be constrained by data types or attribute availability.
- Choosing meaningful classification breaks (ranges) helps communication.
- Label behavior can differ at different zoom levels — test what you set.
- Styling works in tandem with other tools (annotations, map comments, etc.), so your map remains consistent.
- Complex styling may cost some rendering performance, so keep it balanced.
Styling in action
Imagine you uploaded a vector of site assets, each with a “status” field (e.g. “Operational”, “Needs Maintenance”, “Offline”). With styling:
- You could color “Operational” green, “Needs Maintenance” yellow, “Offline” red.
- Use opacity to de-emphasize old records or features outside your current area of interest.
- Label only the highest-priority assets, and only when zoomed in, so your map stays clean at larger scales.
- Set your vector layer to fade out when zoomed out far — giving way to other layers or basemaps.
Maps are more communicative when your data is styled intelligently. With the new vector styling tools in Birdi Map 2.0, you can make your spatial insights clearer, more consistent, and easier to act on.
👉 Learn more in the Knowledge Base