
Birdi's annotation reports just got a major upgrade

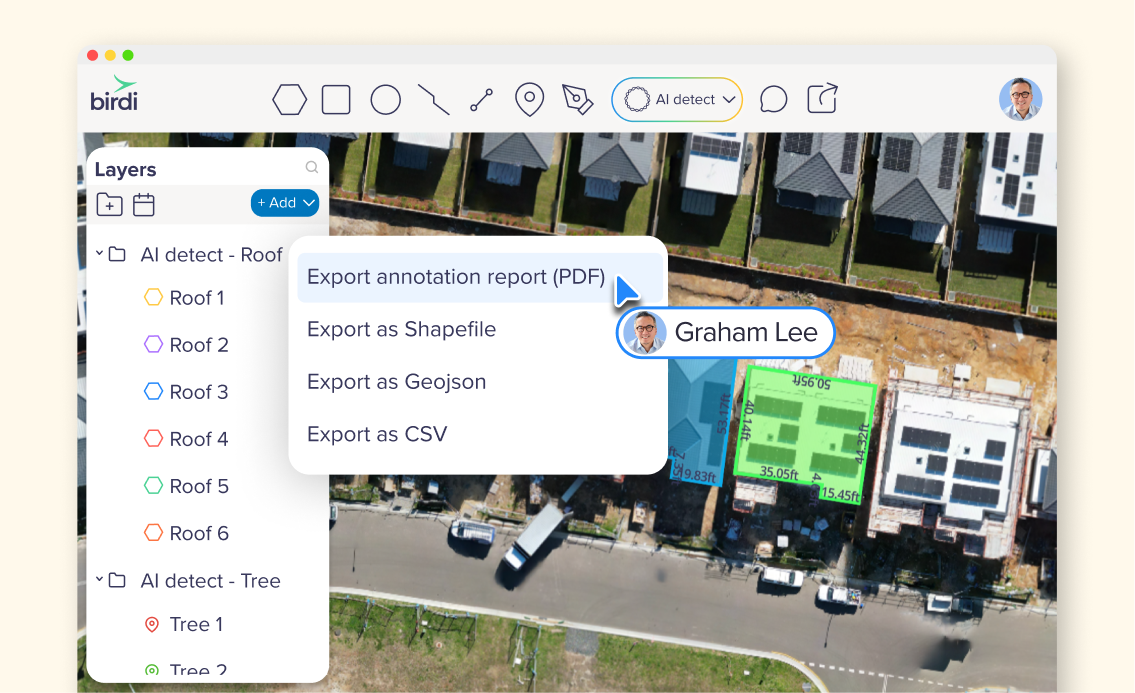
Birdi's Annotation Report turns any set of map annotations — areas, markers, lines, polygons, circles, rectangles or volumetrics — into a single, branded PDF you can hand straight to a client or stakeholder. It's just had a major upgrade: reports now go well beyond a basic export, compiling a full coverage overview, a measurement summary table, and a dedicated detail page for every annotation into one document.
(Available on Growth & Ultimate plans)
What's new in the Annotation Report
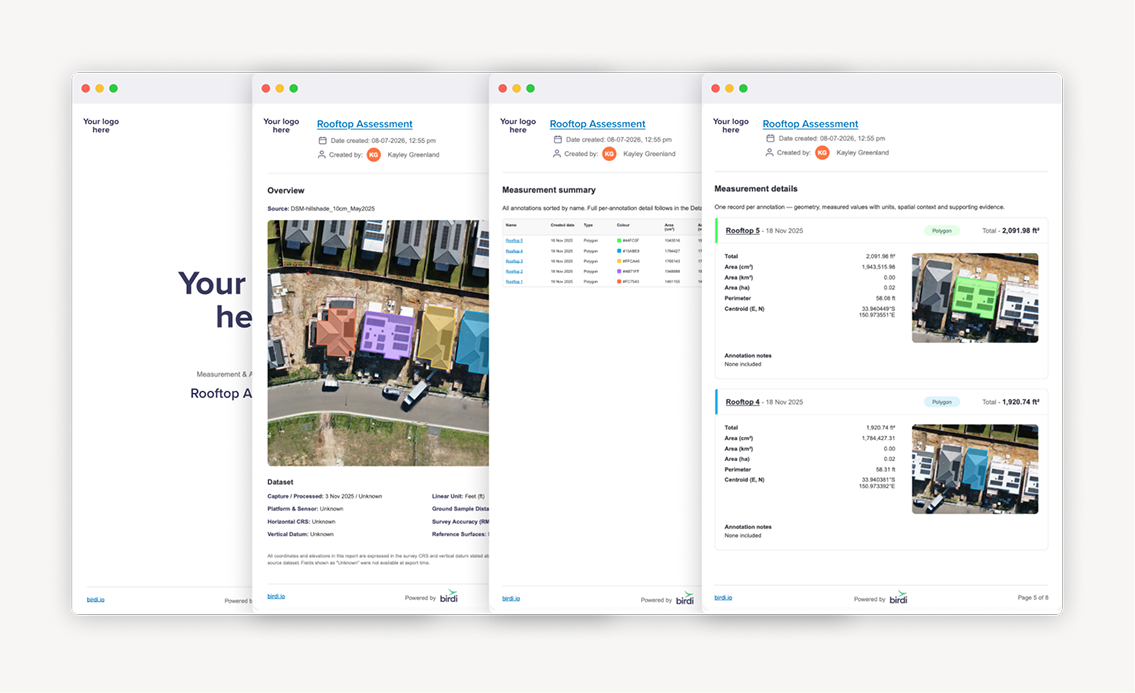
- Annotation coverage overview — headline stats and a breakdown by annotation type
- Full measurement summary table — every annotation listed, with links straight back into the map
- Per-annotation detail pages — geometry, measured values, spatial context and any notes you've added, broken out one section per annotation
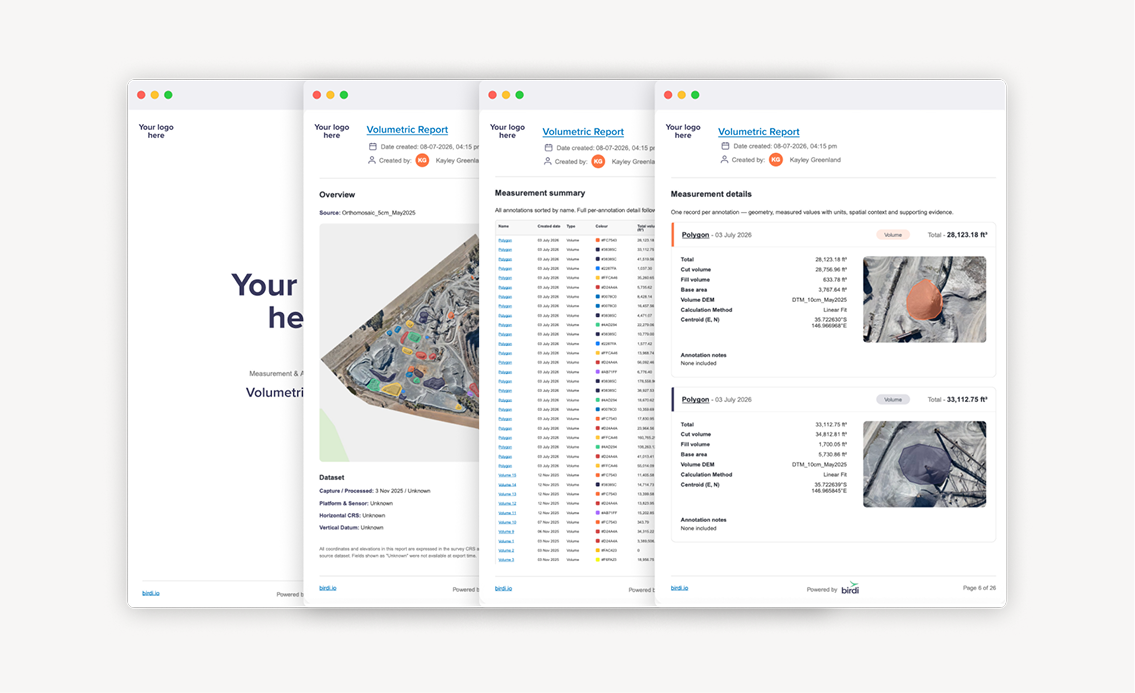
- Works across every annotation type — mix areas, markers, lines, polygons, circles, rectangles and volumetrics into a single report
Popular use cases
- Mining & resources — stockpile and pit measurements, haul-road lengths, site features and area take-offs for handover or reporting
- Construction — progress reporting, area-of-interest summaries, quantity take-offs, defect and inspection records
- Any drone or survey organization — a branded deliverable that packages measurements, coordinates and context into one shareable PDF
How to generate a report
- Get your annotations ready — set the layer you want as the backdrop (ortho, DEM, hillshade or base map) to visible
- Choose what to include — a single annotation, a selection, a folder, multiple folders, or export straight from Table view
- Let it generate — Birdi builds the PDF in the background and it appears as the top layer once ready
- Download and manage — download, open in a new tab, duplicate, move to a folder, or pin it to the map with a marker
Things to keep in mind
- The report crops to your annotation extent — draw a low-opacity bounding box first if you want the whole map shown in the overview
- Switch to imperial units in Settings before generating if that's what you need
- Add notes to your annotations — they flow through to the detail pages and make the report far more useful
- Your workspace logo appears automatically on the cover if branding is set up
FAQ
What annotation types are supported?
All of them — areas, markers, lines, polygons, circles, rectangles and volumetrics — and you can mix them into a single report.
Is the Annotation Report available on all plans?
It's available on Growth and Ultimate plans.
Can I export in imperial units?
Yes — switch your base units to Imperial in Settings before generating the report.
Can I run a report on annotations created in bulk with AI Detect?
Yes — run the report at folder level to cover the whole set (even thousands of annotations) in one export.
A faster way to hand over what you've measured
Annotation Reports give you a polished, professional record of your map annotations without any manual formatting — built right into your workflow.
👉 Learn more in the Knowledge Base